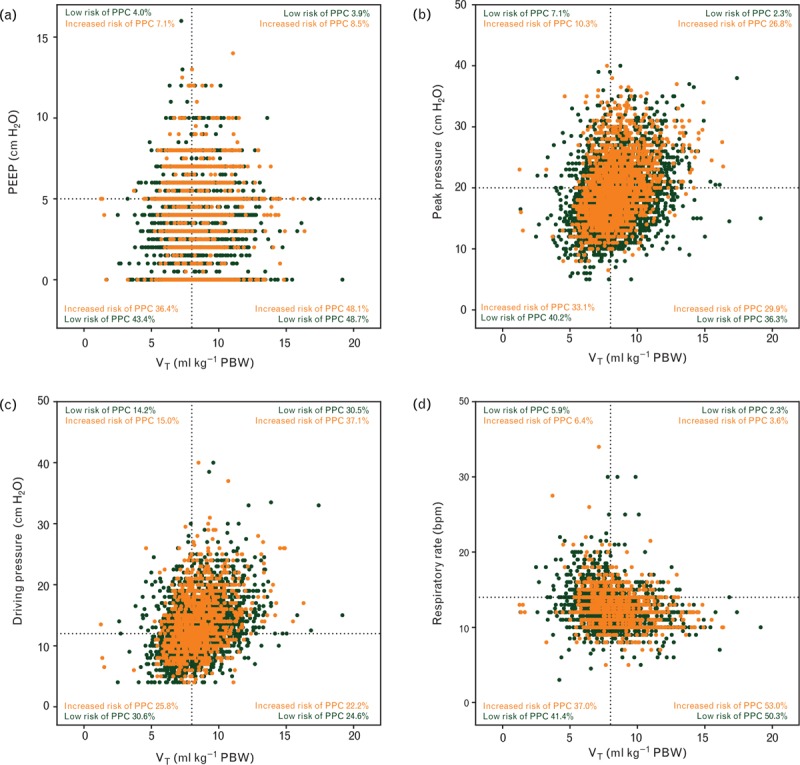
Fig. 3.

Scatterplots showing distribution of (a) tidal volume with positive end-expiratory pressure combinations; (b) tidal volume with peak pressure; (c) tidal volume with driving pressure; (d) tidal volume with respiratory rate in patients at increased vs. patients at low risk of PPCs. bpm, breaths per minute; PBW, predicted body weight; PEEP, positive end-expiratory pressure; PPC, postoperative pulmonary complications; VT, tidal volume.
