Figure 4.

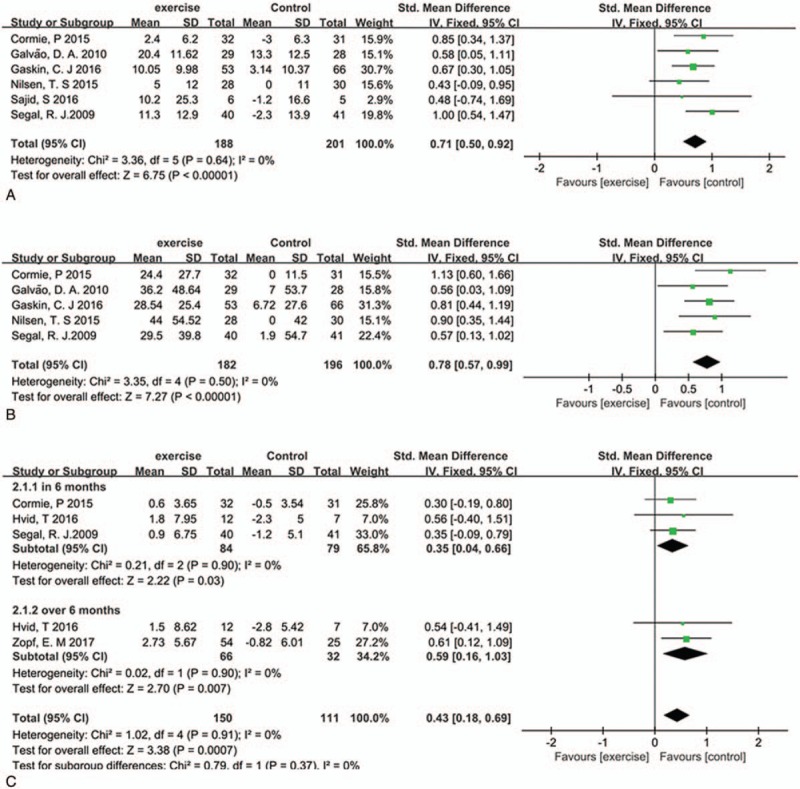
Plot A is the change in chest press compare exercise group and control group, plot B is the change in leg press, and plot C is change in VO2 peak in 6 months and over 6 months. VO2 = oxygen consumption.

Plot A is the change in chest press compare exercise group and control group, plot B is the change in leg press, and plot C is change in VO2 peak in 6 months and over 6 months. VO2 = oxygen consumption.