
Figure 9.
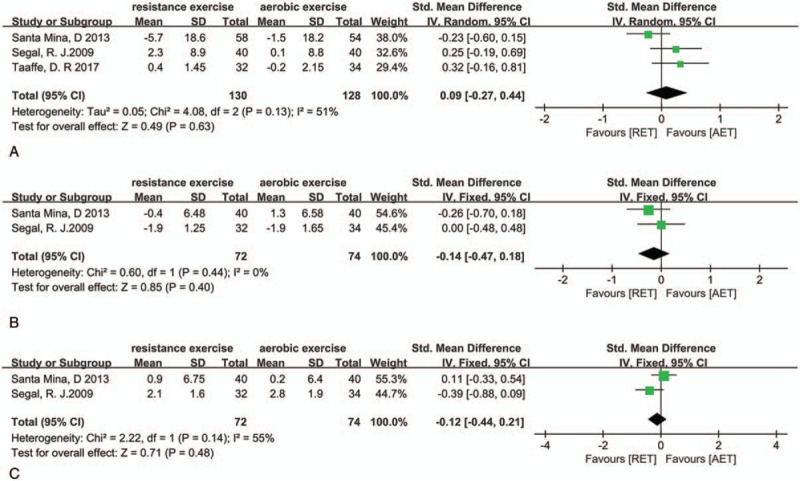
Plot A is the pooled outcome about fatigue between AET and RET, plot B is the outcome about fat mass, and plot C is the pooled outcome about VO2 peak. AET = aerobic exercise training, RET = resistance exercise training, VO2 = oxygen consumption.