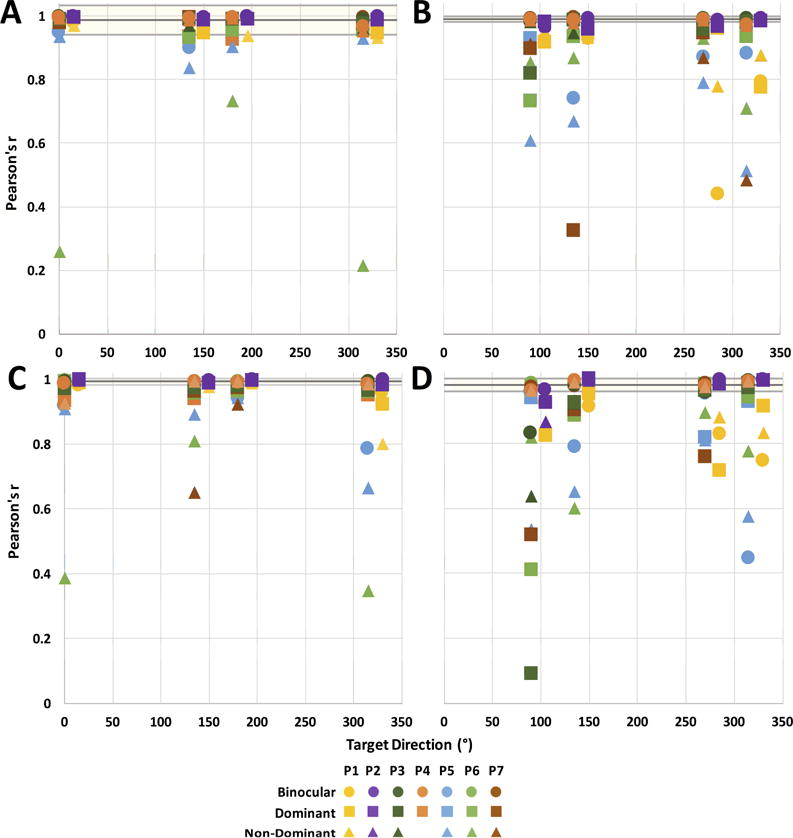
Figure 4.

Pearson correlation coefficients for inter-eye positions during 5°/s (A, B) and 10°/s (C, D) target motion. Correlations between horizontal (A, C) and vertical (B, D) eye positions are shown separately. Black and gray horizontal lines represent the mean and standard deviation of controls’ correlation coefficients across all target directions for the given velocity and motion dimension. CFL participants P1 and P2 are plotted at a +15° horizontal offset from the rest of participants for clarity.
