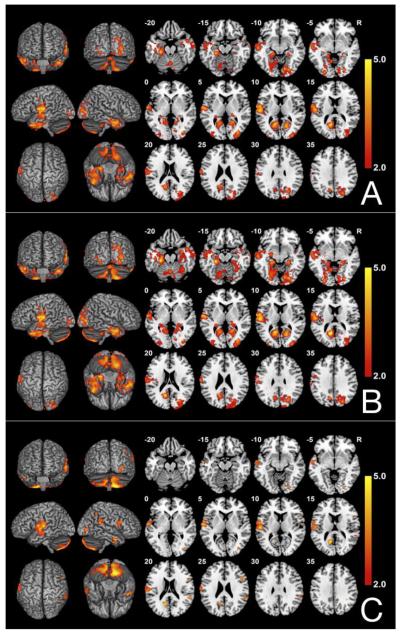
Fig. 1.
FSL-VBM results comparing 40 individuals with PD to 40 matched healthy controls (A) Before adding covariates; (B) Controlling for age and sex; (C) Controlling for age, sex, and TICV. Contrast T map shows significant clusters (P<.05, FWE corrected) where reduced GM densities are located in individuals with PD. Neurological convention (L is L).

