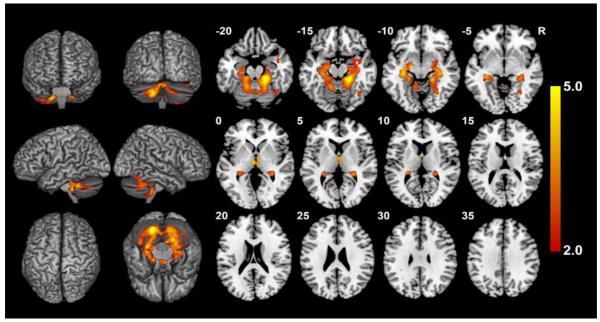
Fig. 2.
FSL-VBM results of 88 control participants split between those with large and small TICV before controlling for TICV, controlling for age and gender. Contrast T map shows significant clusters (p<.05, FWE corrected) where large TICV participants showed smaller volumes than small TICV. No region remained significant following correction for TICV. Neurological convention (L is L).

