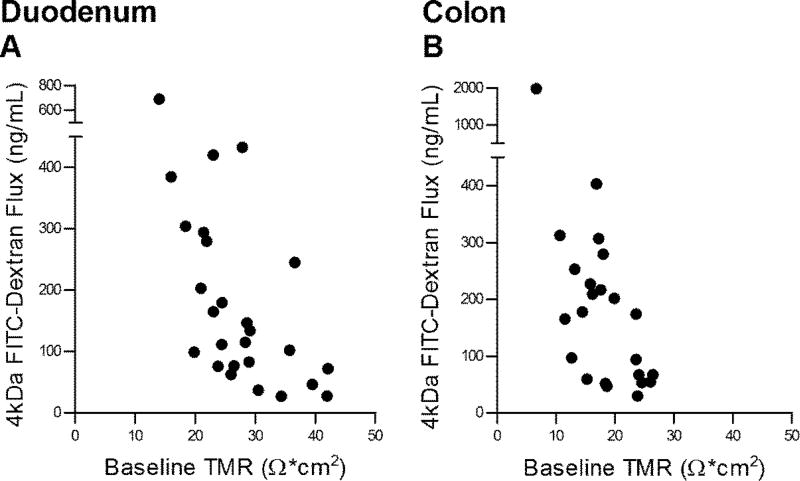
Figure 4.
Correlations between baseline transmucosal resistance (TMR) and FITC-Dextran Flux (4kDa) across the same biopsies. (A) Correlation between baseline duodenal TMR and 3 hr cumulative submucosal FITC-Dextran (4kDa) concentration. Pearson’s correlation coefficient = −0.57, p<0.0006. Number of XY pairs=32. (B) Correlation between baseline colonic TMR and 3 hr cumulative submucosal FITC-Dextran (4kDa) concentration. Pearson’s correlation coefficient = −0.58, p<0.0012. Number of XY pairs=28. HV and IBS-C biopsy data were combined. A p-value of <0.05 was considered significant.

