
FIGURE 3.
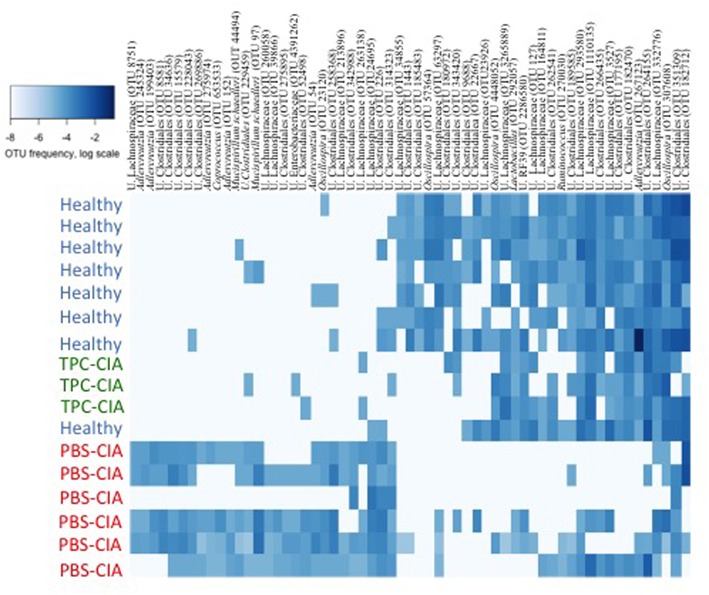
Heatmap of OTU abundances in feces of TPC-CIA vs. PBS-CIA and healthy mice. Heatmap constructed by machine learning at day 34 showing the relative proportions of microbial lineages. Darker shades of blue indicate a higher abundance of an OTU on a logarithmic scale. The machine-learning algorithm was trained on the healthy and PBS-CIA groups, and tested on the TPC-CIA group, with all test samples classified as healthy. U, Unclassified. PBS-CIA mice (red, n = 6); TPC-CIA mice (green, n = 3); Healthy - TPC or PBS-treated healthy mice (blue, n = 8). OTUs are presented by annotation and OTU number.