Figure 2.
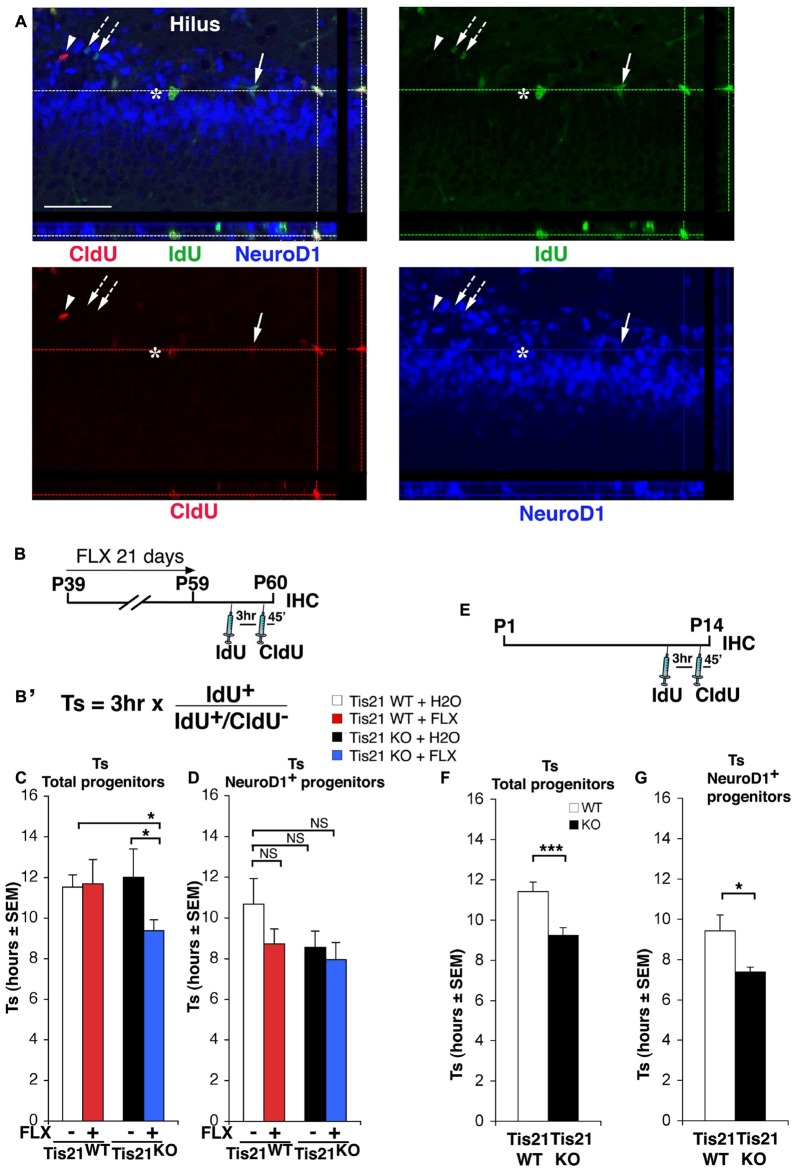
Treatment with fluoxetine significantly reduces the length of the S phase in Tis21 knockout 2-month-old dentate gyrus progenitor cells. (A) Representative confocal images of cycling cells (40× magnification), with 3D reconstruction from Z-stack and orthogonal projections of triple- and double-positive cells. Cycling cells are shown: (i) cells in S-phase during the 3 h interval after the IdU pulse and before CldU (IdU+/CldU− cells, green, arrow; or NeuroD1+/IdU+/CldU−, blue-green, arrows with dotted line); (ii) cells in S-phase during the CldU pulse (IdU−/CldU+cells, red, arrowhead); (iii) or cells that were in S-phase during both pulses and continued throughout the cell cycle (IdU+/CldU+, yellow-green, asterisk; or NeuroD1+/IdU+/CldU+, white, at lines intersection). Scale bar, 50 μm. (B) Treatment timeline: 2-month-old wild-type and Tis21 knockout mice, after fluoxetine treatment for 21 days, were injected with IdU and CldU 3 h and 45 min, respectively, before analysis. (B′) Equation to calculate the S-phase length. The ratio of cells that have left the S phase during the interval of 3 h between injections (IdU+/CldU− cells) to the total number of IdU+ cells is equal to 3 h/Ts. (C) Graphs showing the measurement of the length of the S phase (Ts) for the total population of progenitor cells and (D) for the NeuroD1+ progenitor cells population in the different experimental conditions. (C) A shortening of Ts is evident only in the total population of progenitor cells, in the Tis21KO + FLX mice with respect to the Tis21WT and Tis21KO mice. Analysis of simple effects: *p < 0.05, PLSD ANOVA test. (D) NeuroD1+ progenitor cell population, analysis of simple effects: NS p > 0.05, PLSD ANOVA test. Data are mean ± SEM of the analysis of five (C) or 3–4 (D) animals per group (see Supplementary Table S1). (E) Treatment timeline and (F) analysis of S phase length (Ts) for the total proliferating stem/progenitor cells or (G) for the NeuroD1+ progenitor cells in 2-week-old wild-type and Tis21 knockout mice. *p < 0.05, or ***p < 0.001 Student’s t test. Data are mean ± SEM of the analysis of three animals per group.

