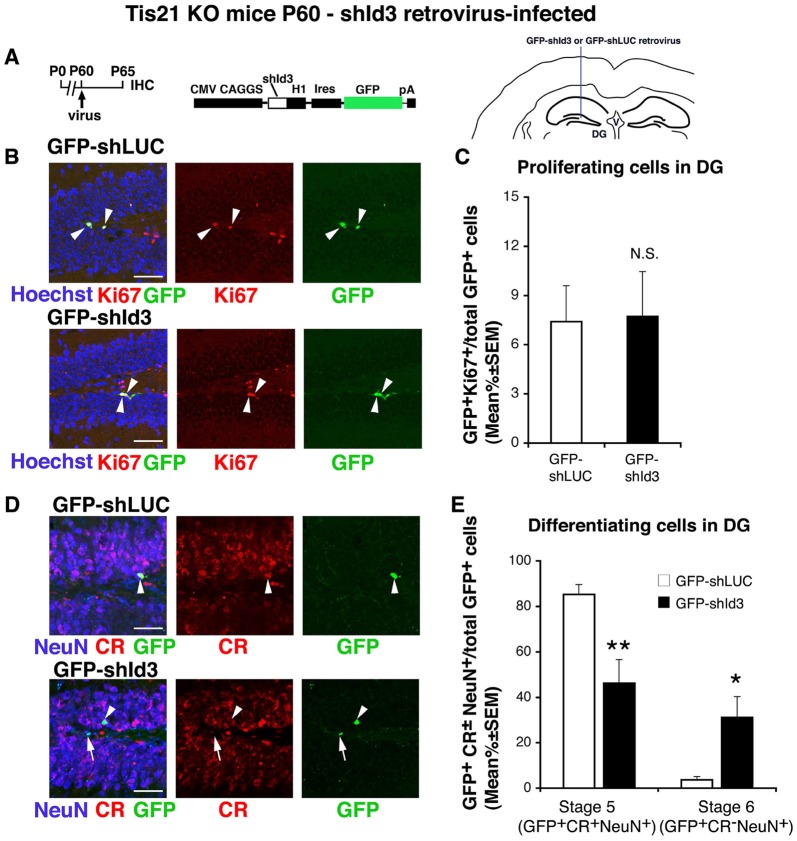
Figure 6.
shId3-retrovirus rescues the defective terminal differentiation of Tis21-null neurons without effects on proliferating cells. (A) Retrovirus infection timeline, structure and injection area. (B) Representative confocal images (40× magnification) of coronal sections of the dentate gyrus, labeled with Hoechst 33258 and with Ki67 and GFP, 5 days after infection with either GFP-shId3 or GFP-shLUC (control) retroviruses. Scale bars, 50 μm. The white arrowheads indicate cells positive for both GFP and Ki67. (C) Percentage ratio between GFP+Ki67+ cells and the total number of infected cells (GFP+), in Tis21 knockout dentate gyrus infected with GFP-shId3 or GFP-shLUC virus. The ratio of dividing cells (Ki67+) is not changed by the shId3 virus, relative to the shLUC control virus infections. NS, p > 0.05 vs. cells infected with GFP-shLUCvirus; Mann-Withney U test. (D) Representative confocal images of dentate gyrus cells triple-labeled with Calretinin, NeuN and GFP, 5 days after infection with either GFP-shId3 or GFP-shLUC retroviruses. Scale bars, 50 μm. White arrows indicate infected terminally differentiated neurons (GFP+Calretinin−NeuN+); arrowheads indicate infected stage 5 immature neurons (GFP+Calretinin+NeuN+). (E) Percentage ratio between stage 5 immature neurons (GFP+stage 5) or stage 6 terminally differentiated neurons (GFP+stage 6) and the total number of infected cells (GFP+), analyzed in Tis21 knockout dentate gyrus infected with either GFP-shId3 or GFP-shLUC virus. The percentages of stage 5 neurons or stage 6 neurons observed in the shLUC virus infections are significantly decreased or increased, respectively, by the shId3 virus. *p < 0.05 or **p < 0.01 vs. cells infected with GFP-shLUC virus; Mann-Withney U test. (C,E) Cell ratios in the dentate gyrus are mean% ±SEM of the analysis of three animals per group.

