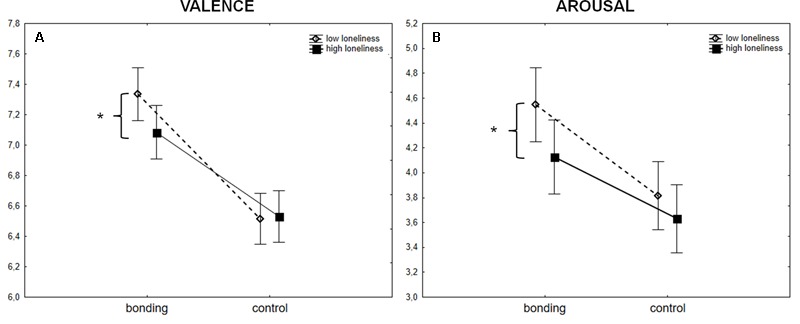
FIGURE 3.

Mean ± standard error of the valence (A) and arousal (B) ratings of the new set of pictures (bonding and control pictures) for the low loneliness and high loneliness groups. Participants with a score above the median for loneliness are depicted by filled black squares, and those with a score below the median are depicted by empty diamonds. ∗p = 0.04 for the comparison between low and high loneliness.
