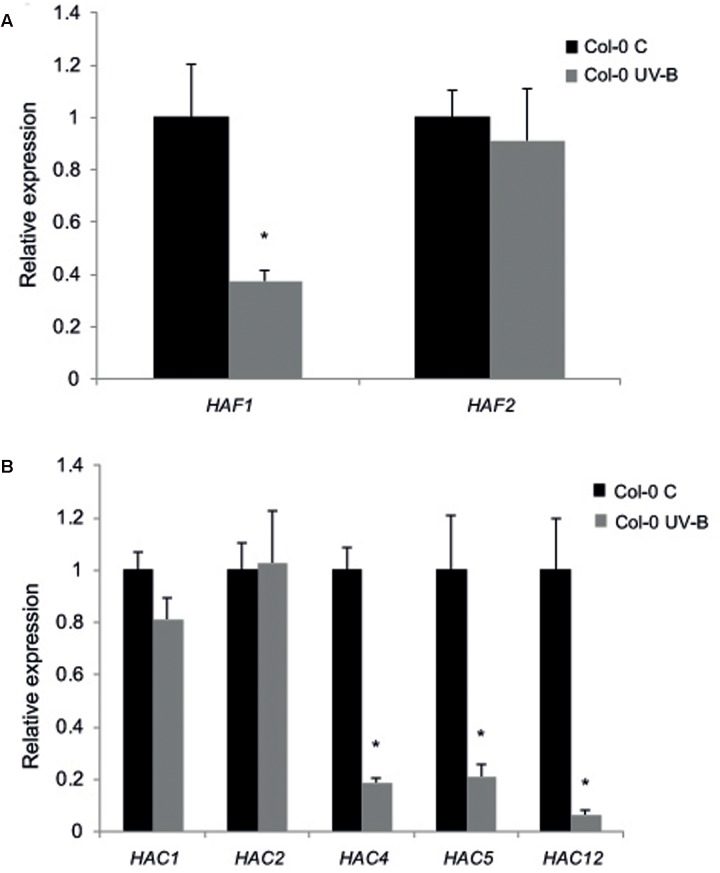
FIGURE 1.
Relative expression of HAF1 and HAF2 (A) and HAC1, HAC2, HAC4, HAC5 and HAC12 (B) transcripts by RT-qPCR. Col-0 Arabidopsis plants were irradiated with UV-B for 4 h (UV-B) or were kept under control conditions without UV-B (control, C). Expression values are relative to the CPK3 control. Data show mean values ±SEM of at least three independent experiments. Statistical significance was analyzed using Student’s t-test (Welch’s T-test) with P < 0.05; differences from the control are marked with an asterisk.

