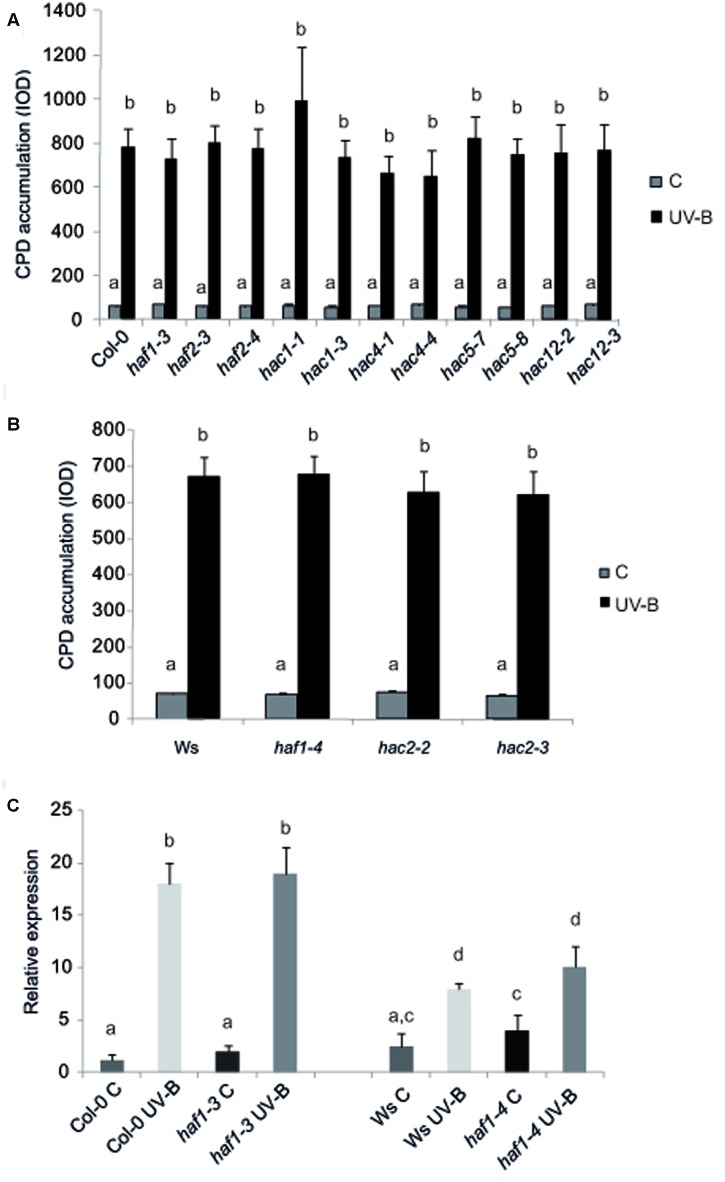
FIGURE 2.
CPD levels in the DNA of WT Col-0, haf and hac mutants (A), and WT Ws, haf and hac deficient plants (B) under control conditions in the absence of UV-B (control, C) and after UV-B exposure for 4h. Experiments were done under conditions that allowed photorepair in the light. 2 μg of DNA was loaded in each well. CPD levels are indicated as integrated optical density (IOD) values. Results represent the average ±SEM of six independent biological replicates. Statistical significance was analyzed using ANOVA, Tukey test with P < 0.05. (C) Relative expression of UVR2 transcripts by qRT-PCR. WT Col-0 and Ws, and haf1-3 and haf1-4 mutant plants were irradiated with UV-B for 4 h or kept under control conditions without UV-B. Data show mean values 6 SD of at least three independent experiments. Different letters indicate significant statistical differences (P < 0.05).

