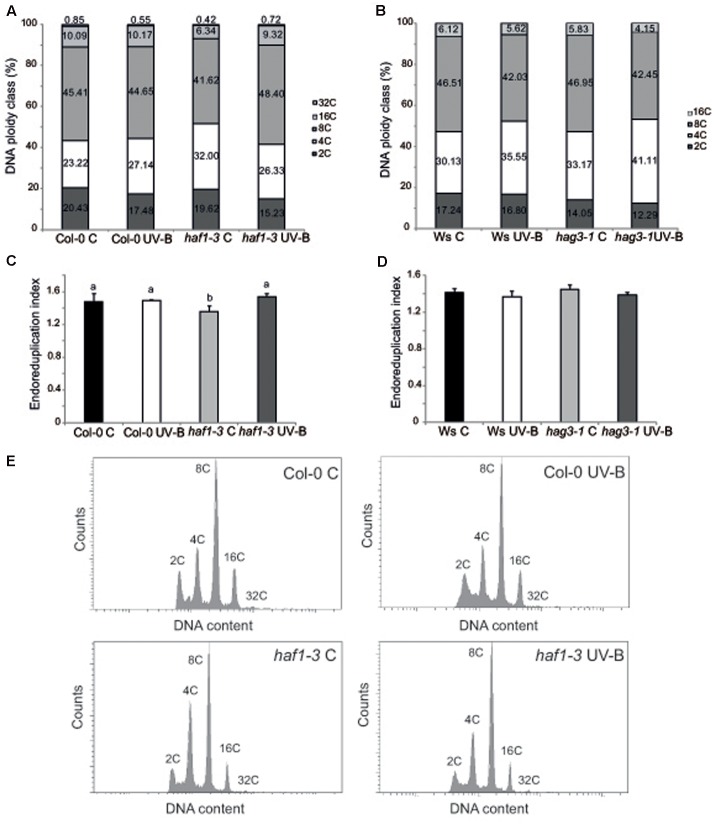
FIGURE 5.
Analysis of DNA ploidy in leaf #5 of Col-0 and haf1-3 plants. Comparison of the nuclear DNA content of Col-0 and haf1-3 (A), and Ws and hag3-1 (B) leaf #5 from UV-B treated and control Arabidopsis plants determined by flow cytometry. (C,D) Endoreduplication index (EI) of cells in leaf #5 from UV-B treated and control Col-0 and haf1-3 (C), and Ws and hag3-1 (D) Arabidopsis plants. Statistical significance was analyzed using ANOVA, Tukey test with P < 0.05; differences from the control are marked with different letters. (E) Flow cytometry profiles of the nuclear DNA content of Col-0 and haf1-3 leaf #5 from UV-B treated and control Arabidopsis plants.

