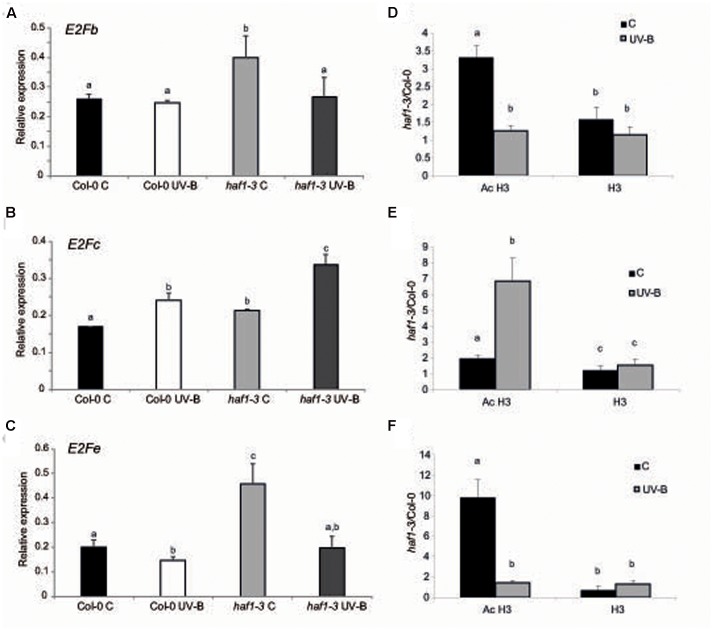
FIGURE 6.
Relative expression of E2Fb (A), E2Fc (B), and E2Fe (C) transcripts in Col-0 and haf1-3 plants by RT-qPCR and AcH3 status of the genes (D–F). Plants were irradiated with UV-B for 4 h (UV-B) or were kept under control conditions without UV-B (control, C). Expression values are relative to the CPK3 control. Data show mean values ±SEM of at least three independent experiments. Statistical significance was analyzed using ANOVA, Tukey test with P < 0.05; differences from the control are marked with different letters. (D–F) ChIP-qPCR analysis of Ac H3 and total H3 associated to the region 1 of E2Fb (D), E2Fc (E) and E2Fe (F) depicted in Supplementary Figure S7 in UV-B irradiated and control Col-0 and haf1-3 plants. Data was normalized to values obtained using input DNA before immunoprecipitation. Results represent the average of 3 biological replicates ±SEM. Statistical significance was analyzed using ANOVA, Tukey test with P < 0.05; differences from the control are marked with different letters.

