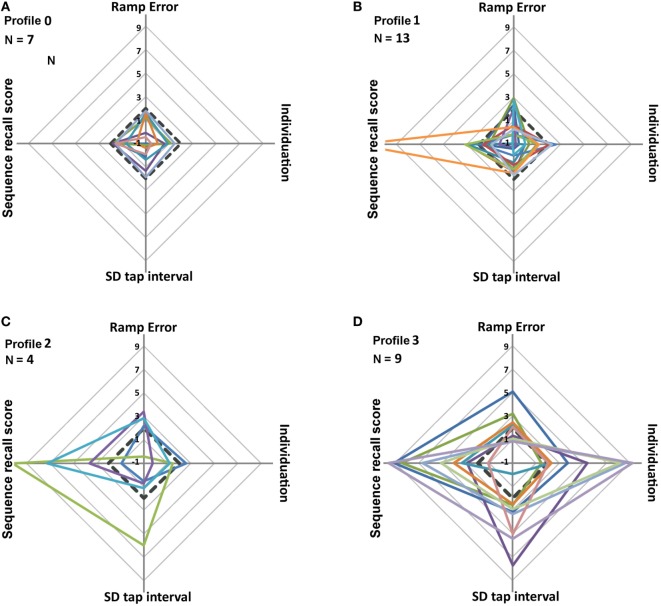
Figure 4.
Radar plots of the four key-Finger Force Manipulandum scores (ramp error in finger force tracking, degree of individuation in multi-finger tapping, tap interval variability in single-finger tapping, and sequence recall index in sequential finger tapping). Each measure represents a z-score relative to the mean and SD of the control group. The 33 patients were subdivided into four types of dexterity profiles (A–D) according to the number of affected z-scores per patient. (A) Profile_0 (all z-scores <2). (B) Profile_1 (one z-score >2). (C) Profile_2 (two z-scores >2). (D) Profile_3 (three or four z-scores >2). Black dotted lines represent the normality threshold (mean + 2SD). Scores > threshold are considered abnormal.

