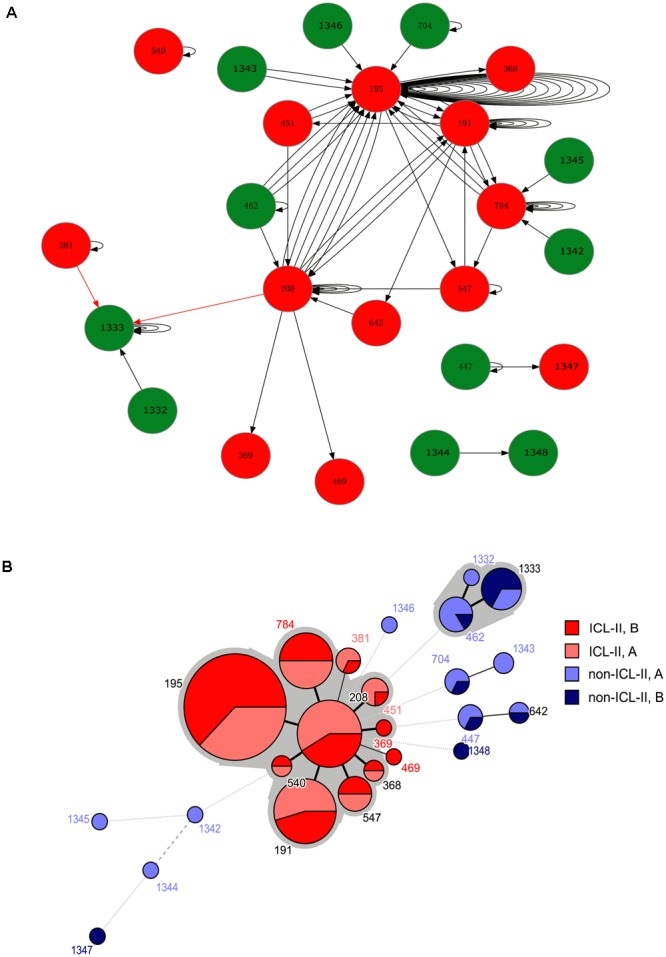
FIGURE 1.

(A) A schematic of A. baumannii within-host evolution. The arrow indicated the alteration of two isolates in one patient. A circle at the head of the arrow indicates that the first isolates in the patients belonged to Group A. A circle at the end of the arrow indicates that the second isolates in the patients belonged to Group B. The black arrow indicates an alteration between the same STs or from non-ICL-II to ICL-II. The red arrow indicated an alteration from ICL-II to non-ICL-II. The number within the circles is the MLST. The color of the circle indicates whether the isolate belonged to ICL-II: Red: ICL-II; Green: non-ICL-II. (B) Minimum spanning tree analysis of all genome-sequenced A. baumannii isolates based on MLST data. Each circle represents an independent ST. The size of each circle indicates the number of isolates. The lines connecting the circles indicate the relationship between different STs. Different types of lines represent the difference in one allele (solid line), two alleles (dashed line), and three or more alleles (dotted lines). Two colored zones surrounding the STs indicate that they belong to the same clonal complex.
