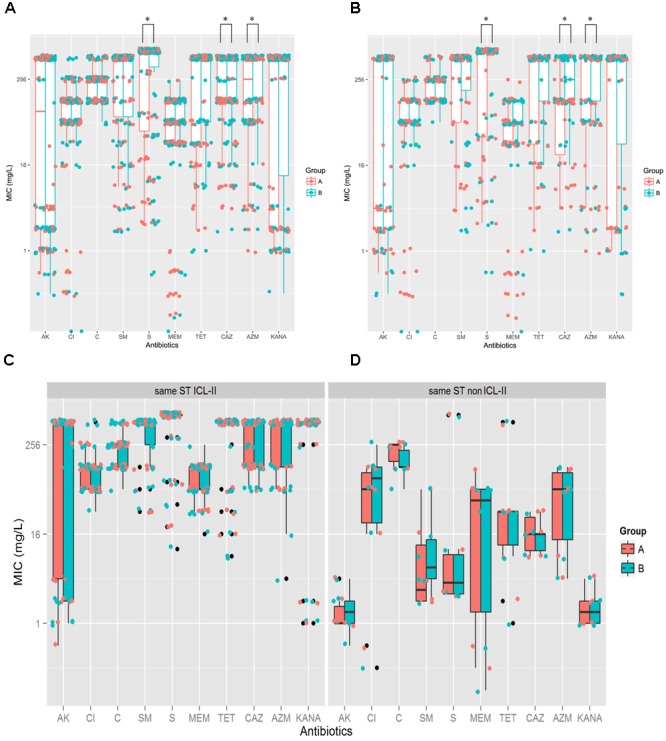
FIGURE 2.

A. baumannii exhibited more resistance after within-host evolution, among the isolates, ICL-II strain demonstrated more resistance than non-ICL-II strains did. (A). For total sample, boxplots for Groups A and B showing the mean ratio of MIC for CAZ between Groups A and B. Dots indicate the detailed MIC values ratio for CAZ. (B) For the isolate pairs harboring different STs, boxplots for Groups A and B showing the mean ratio of MIC for AK, CAZ, MEM, and AZM between Groups A and B. Dots indicate the detailed MIC values ratio for that antibiotic. (C) MIC distributions for 10 antibiotics in whole genome-sequenced A. baumannii isolate pairs harboring the same ICL-II STs. Colors indicate the isolate in Groups A and B. Boxplots for each group indicate the mean MICs against the respective antibiotic. Dots indicate the detailed MIC value for that antibiotic. (D) MIC distribution for 10 antibiotics in all genome-sequenced A. baumannii isolate pairs harboring the same non-ICL-II STs.
