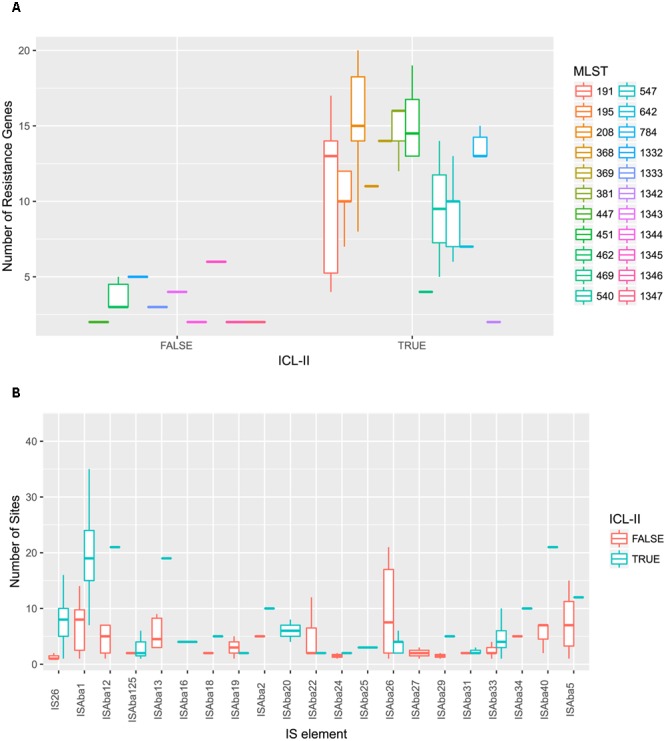
FIGURE 3.

A. baumannii ICL-II presented a higher number of resistance genes and mobile element. (A) A. baumannii ICL-II harbored more resistance gene than non-ICL-II isolates. Colors are indicated for isolates belonging to different MLST. Boxplots for each MLST display the mean number of resistance genes. Dots indicate the number of resistance gene for isolate. (B) A. baumannii ICL-II harbored more ISAba1 than non-ICL-II isolates. Colors are indicated for isolates belonging to different MLST. Boxplots for each MLST display the mean number of mobile element. Dots indicate the number of ISAba1 for each isolate.
