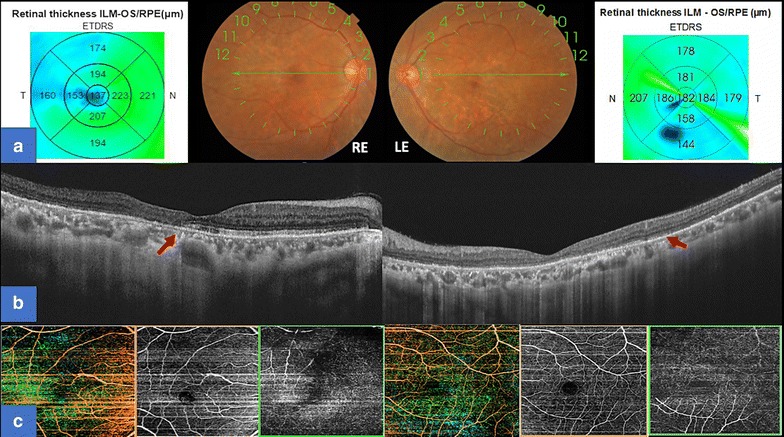
Fig. 3.

Optical Coherence Tomography-Angiography (OCT-A) of both eyes. a Panoramic color picture of the posterior pole, and the thickness macular map of right and left eye respectively. b B-Scan on the foveal line that shows a disruption of the external layers and photoreceptors (The red arrow shows the site of the disruption) of right and left eye respectively. c OCT-A that shows a composite angiography (color image), angiography of the superficial (orange border) and deep layer (green border) of the right and left eye. Shows a normal vascular pattern in the choriocapillaries, superficial and deeper vascular plexus
