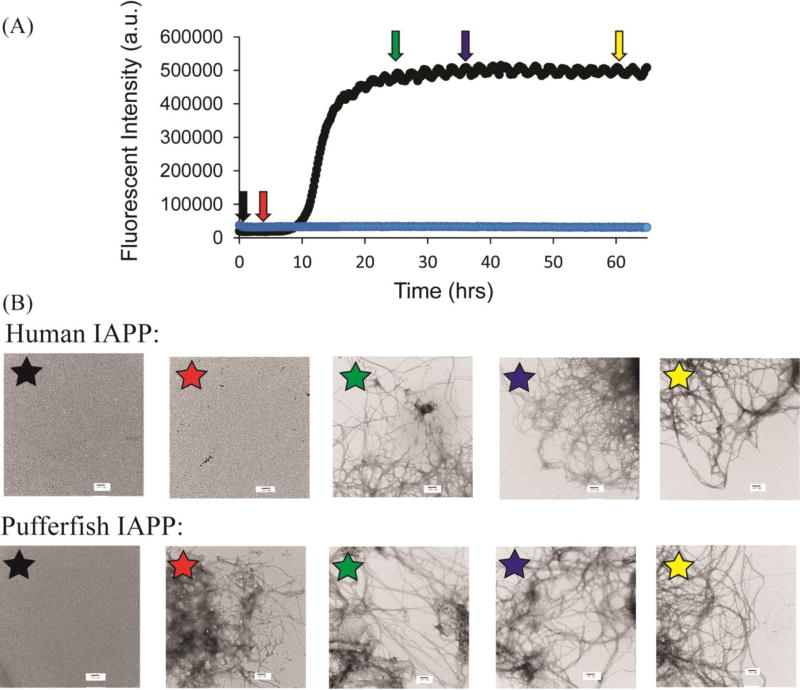
Figure-3.
Analysis of amyloid formation by pufferfish IAPP (blue) and human IAPP (black) in 20 mM tris-HCl at pH 7.4. (A) Fluorescence monitored thioflavin-T assays of amyloid formation. No change in thioflavin-T fluorescence is detected for the pufferfish peptide over the entire time course of the experiment. Arrows indicate times, at which aliquots where collected for TEM analysis. (B) TEM images of samples of human IAPP (top) and pufferfish IAPP (bottom) collected at the different time points. Experiments were conducted with 16 µM IAPP, 32 µM thioflavin-T at 25 °C in 20 mM tris-HCl at pH 7.4. Scale bars in TEM images represent 100 nm.

