Figure 5.

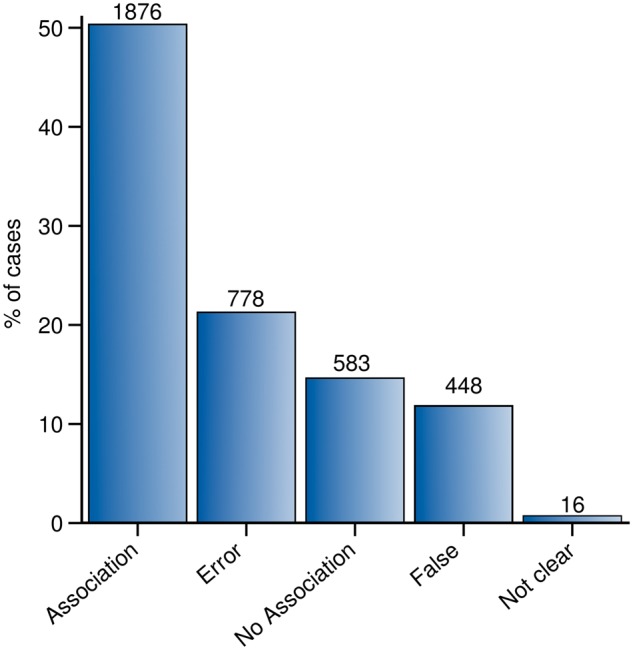
Summary of the agreement results. Each bar in the bar-plot represents the number of validations annotated as: Association, No association, False, Error and Not clear.

Summary of the agreement results. Each bar in the bar-plot represents the number of validations annotated as: Association, No association, False, Error and Not clear.