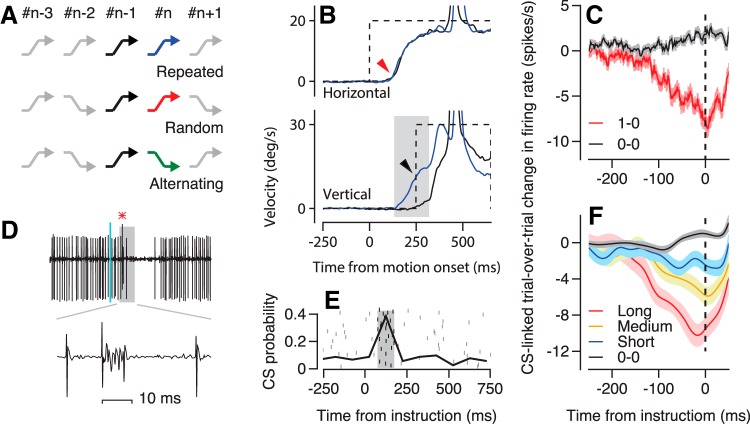
Figure 1.
Approaches used to study learning in the direction of smooth pursuit eye movements. A, From top to bottom, the zigzags indicate the trajectories of the learning target motions in the repeated-direction, random-order, and alternating paradigms. B, The superimposed traces show horizontal and vertical velocity as a function of time from the onset of target motion in example trials from one learning block. Dashed and solid traces show target and eye movement. Black and blue traces show responses in the first versus 100th off-direction learning trials in the repeated-direction paradigm. The red and black arrowheads on the velocity records point out the onset of the initial pursuit and the peak of the learned response in eye movements. The gray shading shows the analysis interval for learning. C, Red and black traces show the trial-over-trial change in firing rate versus time for pairs of trials with versus without a CS in the instruction trial. Vertical dashed line shows the time of the instructive change in target direction. C is reprinted with permission from Yang and Lisberger (2013). D, Simple-spike firing and CS of a representative Purkinje cell in an off-direction learning trial. The red asterisk indicates a CS. E, Raster shows the occurrence of CS responses in relation to the time of the instruction. Black curve shows the probability of CS responses in 100 ms bins. Gray shading shows the analysis interval for CS responses. F, Different color traces show the trial-over-trial change in firing rate versus time for pairs of trials with different durations of CSs in the instruction trial. Vertical dashed line shows the time of the instruction. F is reprinted with permission from Yang and Lisberger (2014a).

