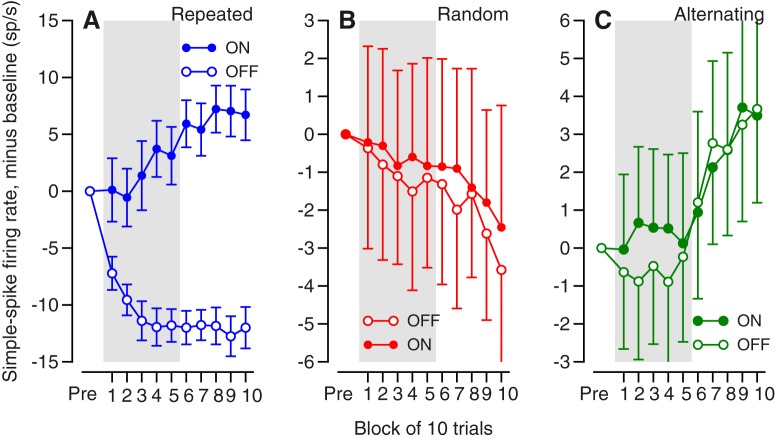
Figure 5.
Comparison of time courses of simple-spike learning in the on- and off-directions for the repeated, random, and alternating-direction paradigms. Each symbol plots the simple-spike firing in the interval from 100 ms before to 50 ms after the onset of an instructive change in target direction, with the baseline simple-spike firing rate subtracted. Filled and open symbols show the firing rate in trials that followed and on-direction versus and off-direction instruction. Error bars show SEMs across the 34 Purkinje cells in the sample. Gray shading indicates the first 50 trials in each block.

