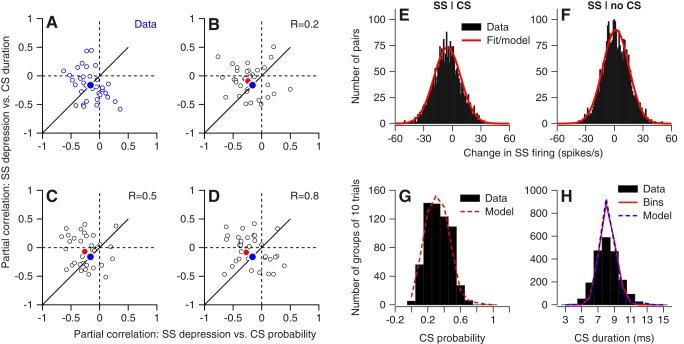
Figure 8.
Agreement between statistics of model and data. A, Structure of the relationship between partial correlations trial-over-trial changes in simple-spike firing with CS probability on the x-axis and duration on the y-axis. Symbols show different neurons. B–D, The same analysis as in A, but for the computational model with the underlying correlation of duration and probability set to 0.2, 0.5, or 0.8 and the temporal decorrelation set to 0.8. Blue and red filled symbols show the averages for the data and the model, respectively. E, F, Distributions of trial-over-trial changes in simple-spike firing, contingent on the presence (E) or absence (F) of a CS response to the instructive change in target direction on the first trial of the pair. Black histograms show the data across all Purkinje cells, and the red curve shows the best-fitting normal distribution, also used in the model. G, Distribution of CS probability. Black histogram shows analysis of the data from all Purkinje cells in bins of 10 trials, and the red dashed curve shows the same analysis of the model Purkinje cells. H, Distribution of CS durations. Histogram bars show the data based on single trials, continuous blue and dashed red curves show results for the data and the model, based on averaging across bins of 10 trials.

