. 2015 Jun 4;6(8):4876–4883. doi: 10.1039/c5sc00685f

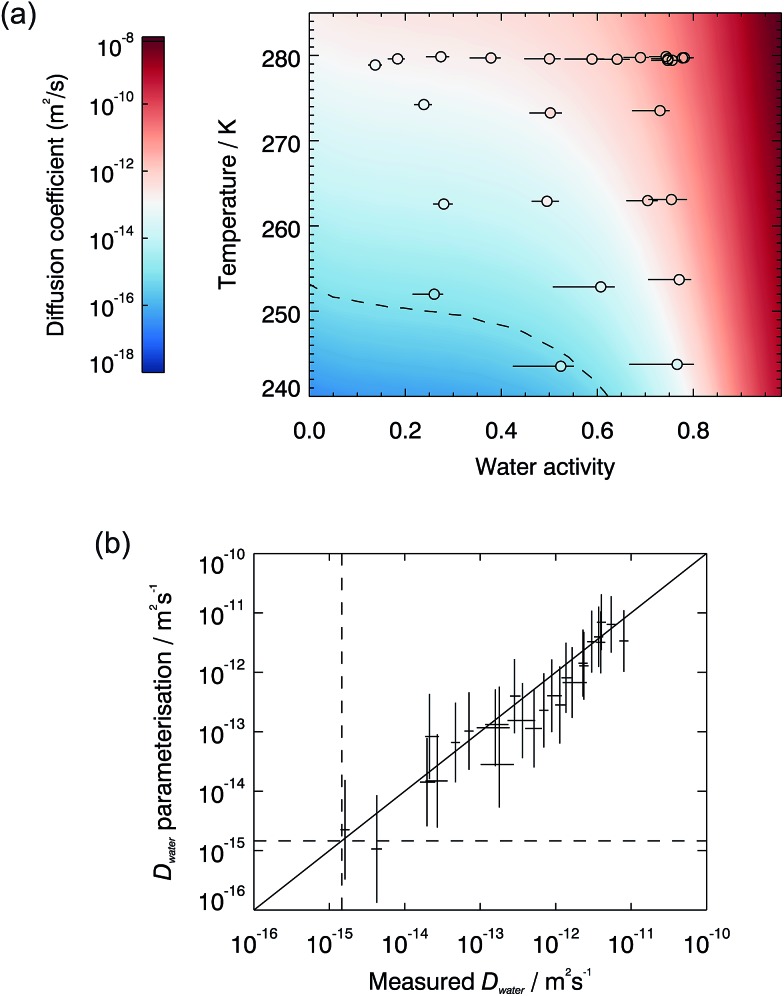
Fig. 1. (a) Diffusion coefficients of water in SOM. Experimental data points are shown as coloured circles and the fit is the shaded background, both coloured on the same scale. The differences in colour between the background and circle interiors show the difference between the fit and the measured data points. Multiple measurements were performed at a water activity of 0.75 and 280 K over the course of 4 months to verify that the diffusive properties of the sample did not change with age. These datapoints are shown to be in good agreement with each other and the fit. (b) A one-to-one plot showing the measured water diffusion coefficients vs. the parameterisation. The dashed lines mark the regions above which the halftime for water diffusion into a spherical droplet of radius 100 nm is less than 1 s.

Fig. 1