. 2015 Jun 4;6(8):4876–4883. doi: 10.1039/c5sc00685f

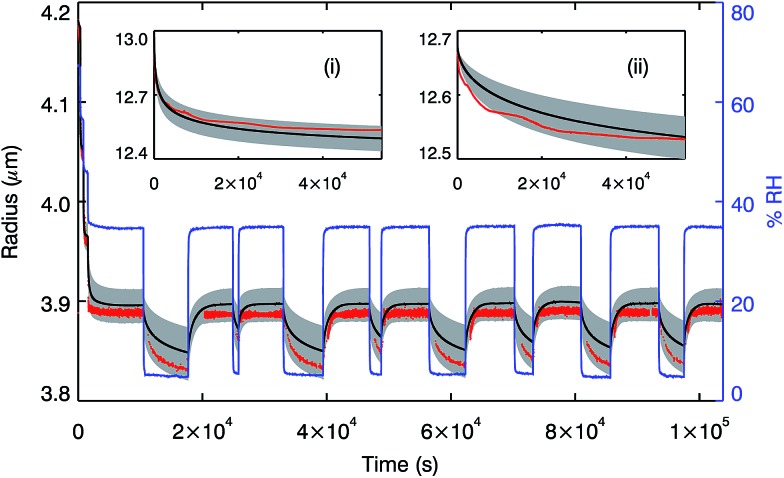
Fig. 4. The main plot shows the changing radius of a sucrose droplet following a repeatedly stepped RH profile (blue line) at room temperature, measured using optical tweezers (red points). The same RH profile was run through the model for a droplet with 1000 shells; the output radius is shown by the black line, with the grey shaded region corresponding to the error in the measured RH of ±2%. Inset (i) shows the size change recorded in an EDB for a 13.03 μm droplet confined and equilibrated at 53% RH experiencing a rapid step change (halftime for RH change ≪ 1 s) to 20% RH (red line). The equivalent model output is shown in black, run with 3000 shells, with the grey region corresponding to a ±2% error in starting water activity and chamber RH. Similarly, inset (ii) shows the size change recorded in an EDB for a 12.68 μm droplet confined and equilibrated at 35% RH experiencing a rapid step change to 15% RH (red line). Again, the model output is shown in black, with the grey region corresponding to a ±2% error in starting water activity and chamber RH. Uncertainties in the experimentally determined radii are estimated to be ±50 nm.

Fig. 4