. 2015 Jun 1;6(8):4884–4888. doi: 10.1039/c5sc01562f

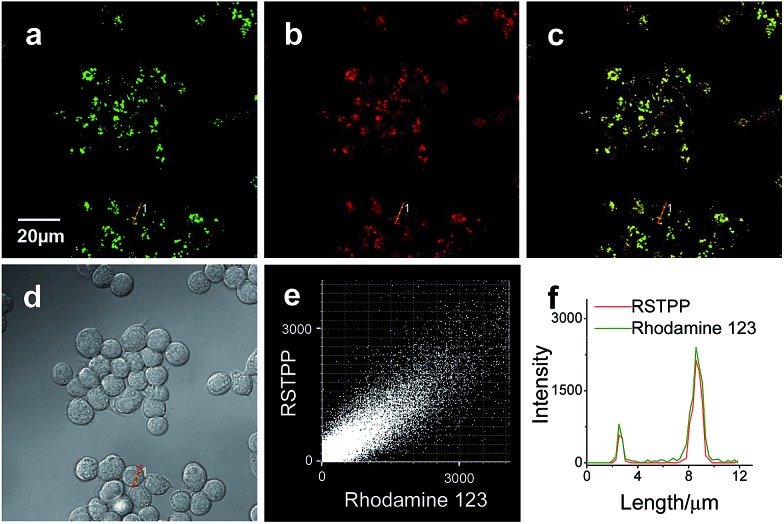
Fig. 2. Colocalization of rhodamine 123 and RSTPP in macrophages (Raw264.7 cells). Cells were co-stained with rhodamine 123 (500 nM) and RSTPP (10 μM), and then treated with HOCl (50 μM) at 37 °C for 20 min. (a) Fluorescence image from the rhodamine 123 channel (λ ex = 488 nm, λ em = 495–550 nm). (b) Fluorescence image from the RSTPP channel (λ ex = 559 nm, λ em = 570–670 nm). (c) Merged image of images (a) and (b). (d) Corresponding differential interference contrast (DIC) image. (e) Intensity correlation plot of rhodamine 123 and RSTPP. (f) Intensity profiles of rhodamine 123 and RSTPP within the linear ROI 1 (red lines in (a) and (b)) across the Raw264.7 cell.

Fig. 2