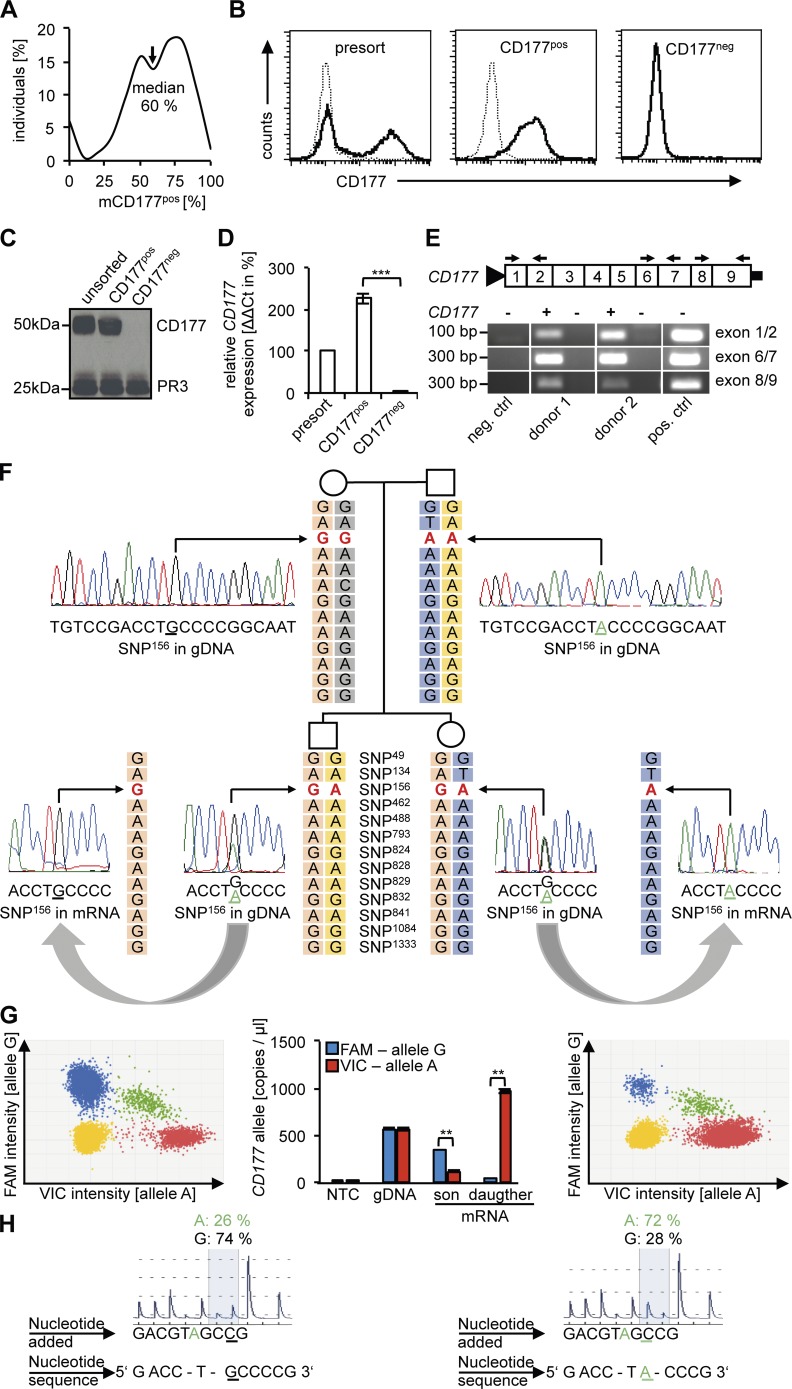
Figure 1.
CD177pos neutrophils from bimodal individuals contain CD177 protein and express only one CD177 allele either of paternal or maternal origin, whereas CD177neg neutrophils produce neither CD177 protein nor mRNA. (A) The percentage of CD177pos neutrophils by flow cytometry in 165 normal controls is shown as percentage of individuals per decile. (B) A typical flow cytometry experiment before (presort) and after magnetic cell sorting yielding CD177pos and CD177neg neutrophil subsets is given. Samples obtained as shown in B were subjected (C) to immunoblotting for CD177 and proteinase 3 (PR3) as a control protein (n = 4 different donors), and (D) to CD177 gene expression analysis by qRT-PCR. CD177 mRNA of presorted neutrophils was set at 100% (n = 3 different donors). (E) RT-PCR with different CD177 exon-spanning primers (black arrows) was performed in CD177pos and CD177neg neutrophils from two neutrophil donors to exclude truncated CD177 mRNAs (n = 2 different donors). (F) An example for monoallelic CD177 gene expression in a family with two offspring is depicted. Haplotype analysis showed an informative heterozygous GA SNP (in red, rs45571738) in the genomic DNA (gDNA) of both offspring whereas maternal gDNA showed homozygous GG and paternal gDNA AA. At mRNA, the son monoallelically expressed the maternal G and the daughter the paternal A allele as demonstrated by Sanger sequencing. The parental haplotype that is inherited by the offspring is boxed in light orange (maternal) and blue (paternal). (G) Digital PCR for the monoallelically expressed G allele for SNP156 in the son (left) and A allele in the daughter (right). Dot plots are depicted with each dot representing one of the 20,000 analyzed wells on the digital PCR chip. Blue dots represent the G (FAM-labeled) and red dots the A (VIC-labeled) allele, whereas yellow and green dots do not allow unequivocal allele identification. Quantitative assessment (middle) shows 75% G allele expression for the son and 96% for the daughter. gDNA was assessed as a control showing even distribution of both alleles (n = 2). (H) Pyrosequencing reveals MAE of the G allele (74%) for the son and the A allele (72%) for the daughter, respectively. Note that quantitative assays for assessment of MAE use a threshold of ∼70% for the monallelic call (Reinius and Sandberg, 2015). Data in D were displayed as mean± SEM and were analyzed using one-way ANOVA. ***, P < 0.001. Data in G were given as Poisson plus ratio with confidence intervals and were analyzed using Student’s t test. **, P < 0.01.

