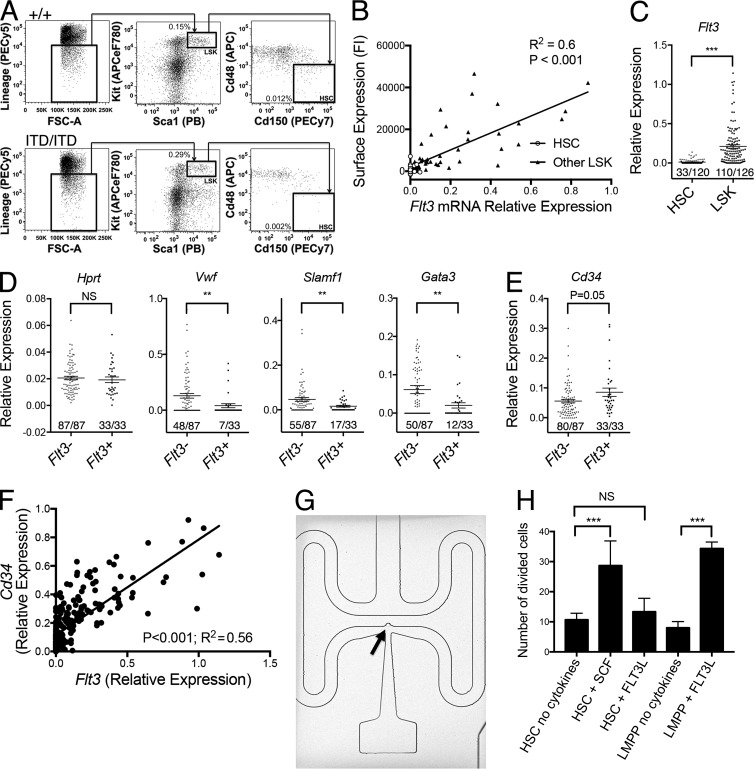
Figure 1.
Single-cell analysis of the phenotypic HSC compartment. (A) Representative flow cytometry–based analysis and quantification of LSK cells and phenotypic (LSKCD150+CD48−) HSCs in 8–10-wk-old Flt3+/+ and Flt3ITD/ITD mice. Shown are the mean values for the frequencies (percentage of total BM cells) of the indicated population across all experiments (+/+, n = 31 mice; ITD/ITD, n = 23 mice). (B) Correlation of Flt3 protein cell-surface expression (fluorescence intensity; FI) and Flt3 relative mRNA gene expression level in 28 phenotypic (LSKCD150+48−) HSCs (open circles) and 62 single non-HSC LSK cells (filled triangles) from two 8-wk-old Flt3+/+ mice. P-value represents Pearson correlation coefficient. (C) Flt3 relative mRNA gene expression level in 120 LSKCD150+48− HSCs and 126 single non-HSC LSK cells from 8-wk-old Flt3+/+ mice (n = 5 mice). P-value at the top of the graph represents unpaired t test; the x/y figures beneath each dot plot indicate the number of cells demonstrating amplification for indicated gene (x) and total numbers of cells analyzed (y). (D) Relative mRNA gene expression level of Hprt, Vwf, Slamf1, and Gata3 in 120 LSKCD150+48− HSCs from 8-wk-old Flt3+/+ mice stratified according to presence (n = 33) or absence (n = 87) of Flt3 expression (n = 5 mice). (E) Relative mRNA gene expression level of Cd34 in 120 LSKCD150+48− HSCs from 8-wk-old Flt3+/+ mice stratified according to presence (n = 33) or absence (n = 87) of Flt3 expression (n = 5 mice). (F) Correlation of Flt3 and Cd34 relative mRNA gene expression level in 120 phenotypic HSCs and 126 single non-HSC LSKs from 8-wk-old Flt3+/+ mice (n = 5 mice). (G) Single mouse phenotypic HSC (arrow) captured in a 4.5-nl reaction chamber for single-cell gene expression analysis (representative image from one experiment). (H) Number of cells undergoing cell division after incubation of 180 single LSKCD150+48− HSCs or LSKFlt3high LMPPs under the indicated conditions for 5 d followed by culture in a full cytokine cocktail (see Materials and Methods) for a further 10 d. SCF indicates stem cell factor, and FLT3L indicates FLT3 ligand. Three independent experiments with 60 cells per experiment. P-values represent χ2 analysis comparing frequency of cells undergoing cell division of a total of 180 plated cells in the three experiments. Data are shown as mean (SEM) values. **, P < 0.01; ***, P < 0.001. NS, not significant.

