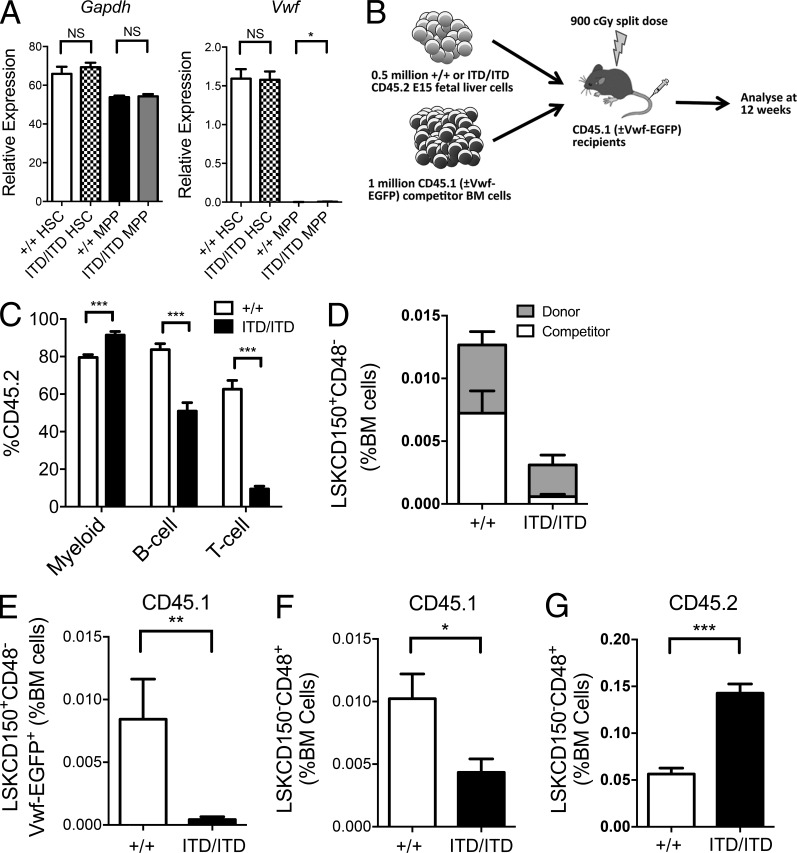
Figure 4.
Flt3-ITDs cause cell-extrinsic suppression of BM HSCs. (A) Relative mRNA gene expression (normalized to Hprt) of Gapdh and Vwf in E15 fetal liver phenotypic HSCs (LSKCD150+CD48−) and MPPs (LSKCD150−CD48+) from Flt3+/+ and Flt3ITD/ITD mice (n = 9 replicates from three mice per genotype). (B) Experimental design for competitive transplantation experiments. (C) Analysis of engraftment 12 wk after transplantation of 5 × 10⁵ CD45.2 E15 FL cells (Flt3+/+ or Flt3ITD/ITD) into CD45.1 recipients with 106 WT CD45.1 BM competitor cells (four donor FL of each genotype transplanted into two to three recipients in two experiments). Results are expressed as percentage of cells expressing CD45.2 of each lineage, myeloid (Mac1+), B cell (B220+CD19+), and T cell (CD4+ and/or CD8+), in the peripheral blood 12 wk after transplantation. (D) Percentage (of total BM cells) of donor (CD45.2) and competitor (CD45.1) HSCs (LSKCD150+CD48−) in BM of recipient mice 12 wk after transplantation (four donor FL of each genotype transplanted into two to three recipients in two experiments). (E) Percentage competitor Vwf-EGFP+ HSCs (LSKCD150+CD48−Vwf-EGFP+CD45.1) in BM of recipient mice 12 wk after transplantation, expressed as percentage of total BM cells. (F and G) Percentage (of total BM cells) of competitor (CD45.1; F) or donor (CD45.2; G) MPPs (LSKCD150−CD48+) in BM of recipient mice 12 wk after transplantation (four donor FL of each genotype each transplanted into two to three recipients in two experiments). Data are shown as mean (SEM) values. *, P < 0.05; **, P < 0.01; ***, P < 0.001 by t test. NS, not significant.

