Figure 5.
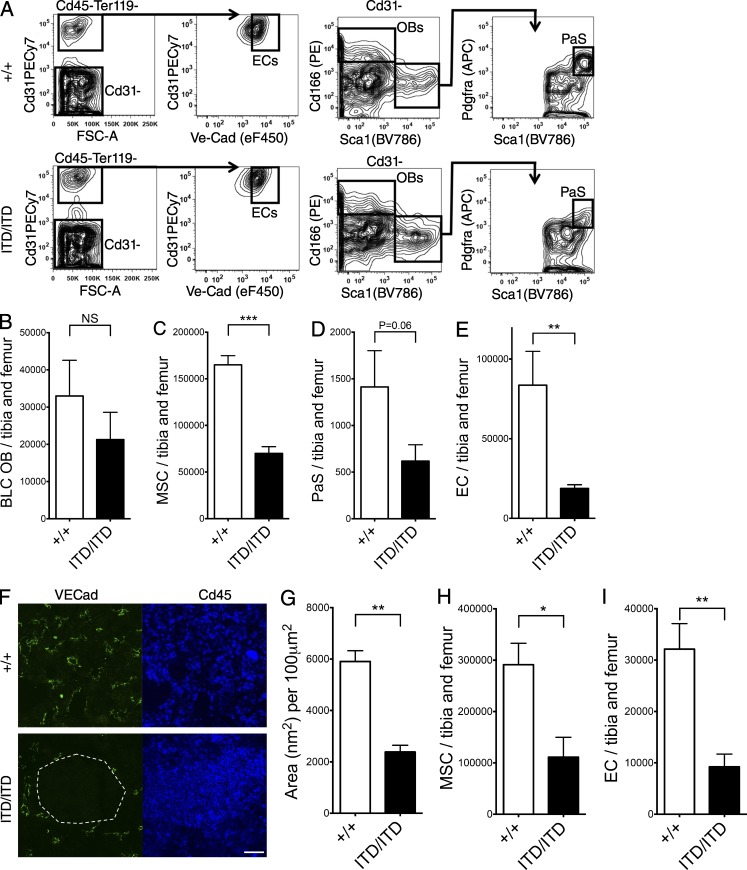
Flt3-ITD–induced myeloproliferation disrupts the vascular HSC niche. (A) Representative gating strategy to identify osteoblasts (OBs; CD45−Ter119−CD31−CD166+Sca1−), PaS MSCs (CD45−Ter119−CD31−CD166−Sca1+Pdgfra+), and ECs (CD45−Ter119−CD31+VE-Cadherin+) in BLCs from Flt3+/+ and Flt3ITD/ITD mice. (B–E) FACS quantification of OBs in the BLC of 8–10-wk-old Flt3+/+ and Flt3ITD/ITD mice (11 and 13 mice per genotype, respectively; B), MSCs (C) and PaS MSCs (D) in the BLC, and ECs in the BLC and BM (E) of 8–10-wk-old Flt3+/+ and Flt3ITD/ITD mice (six and seven mice per genotype, respectively). (F) Representative images of Flt3+/+ and Flt3ITD/ITD BM in which ECs are identified by VE-cadherin and hematopoietic cells by CD45 staining. An area devoid of vasculature and entirely replaced by CD45+ Flt3ITD/ITD hematopoietic cells is highlighted by the white dashed line. Bar, 50 µm. (G) Sum of blood vessel areas in Flt3+/+ and Flt3ITD/ITD mouse BM (n = 15 areas from three mice of each genotype). (H and I) Numbers of MSCs (H) and ECs (I) in recipient mice 12 wk after transplantation of 5 × 10⁵ CD45.2 E15 FL cells (Flt3+/+ or Flt3ITD/ITD) into CD45.1 WT recipients with 106 WT CD45.1 BM competitor cells (two donor FL of each genotype transplanted into two to three recipients in two experiments). Data are shown as mean (SEM) values. *, P < 0.05; **, P < 0.01; ***, P < 0.001 by t test. NS, not significant.

