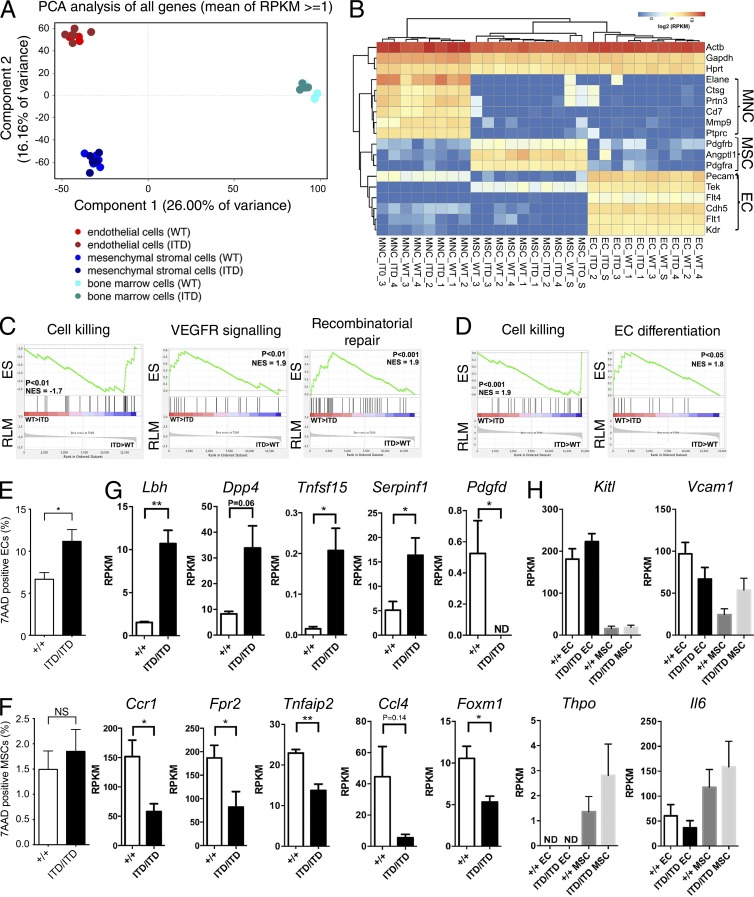
Figure 6.
Molecular features of niche elements in Flt3-ITD mice. BM MNCs, ECs (CD45−Ter119−CD31+), and MSCs (CD45−Ter119−CD31−CD166−Sca1+) from Flt3+/+ and Flt3ITD/ITD 8–10-wk-old mice (four to five mice per genotype) were subjected to global RNA sequencing. (A) Principal component analysis of MNCs, ECs, and MSCs from Flt3+/+ and Flt3ITD/ITD mice. Each dot represents the indicated cell population from one mouse. (B) Expression of hematopoietic, endothelial, and MSC-associated genes in purified populations of MNCs, ECs, and MSCs from Flt3+/+ and Flt3ITD/ITD 8–10-wk-old mice (four to five mice per genotype). (C) GSEA comparing ECs from Flt3+/+ and Flt3ITD/ITD mice for genes involved in regulation of cell killing and regulation of vascular endothelial growth factor receptor signaling pathway and DNA repair (five mice per genotype). (D) GSEA genes comparing MSCs from Flt3+/+ and Flt3ITD/ITD mice for genes involved in regulation of cell killing and regulation of endothelial cell differentiation (five mice per genotype). (E and F) Frequency of 7AAD-positive ECs (E) and MSCs (F) in the BLC of 8–10-wk-old Flt3+/+ and Flt3ITD/ITD mice (six and seven mice per genotype, respectively). (G) Aberrant expression of angiogenesis-associated genes in MNCs from Flt3ITD/ITD mice (four mice per genotype). (H) Expression of genes implicated in extrinsic regulation of HSCs in EC and MSC from Flt3+/+ and Flt3ITD/ITD mice (five mice per genotype). Data are shown as mean (SEM) values. *, P < 0.05; **, P < 0.01 by t test. ND, not detected; NS, not significant.

