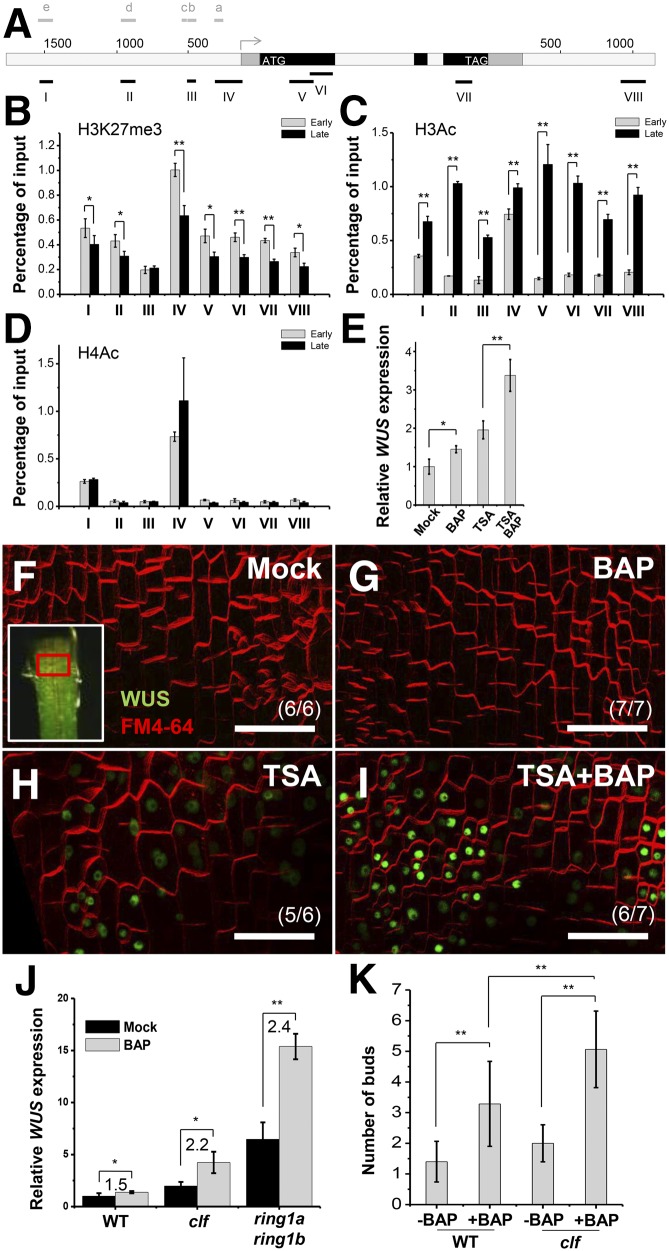
Figure 3.
The Epigenetic Environment Affects Cytokinin Induction of WUS Expression.
(A) A diagram of the WUS genomic region with an arrow representing the transcription start site. Black, coding sequences; dark gray, untranslated regions; light gray, intron/intergenic regions; ATG and TAG, start and stop codons. Black bold lines with Roman numerals indicate fragments amplified by ChIP-qPCR. Gray bold lines with a to e indicate fragments showing in Figure 5A.
(B) to (D) The comparison of histone modifications in early and late stage of leaf axils. Images show ULI-NChIP with H3K27me3 (B), and histone H3 (C) and H4 (D) acetylation of WUS genomic regions using early stage (P8 to P10) and late stage (P15 to P17) leaf axil tissues. Error bars represent sd, which was calculated from three technical replicates. Two biological replicates gave similar results.
(E) Expression of WUS after a 4-h 0.89 μM BAP and/or 1 μM TSA treatment in shoot apex tissues. Leaves were removed before RNA isolation. Error bars indicate the sd of three biological replicates, run in triplicate.
(F) to (I) Expression of ProWUS:DsRed-N7 (green) in P9 leaf petiole cells. Images show WUS expression 15 h after mock (F), 0.89 μM BAP (G), 1 μM TSA (H), or BAP and TSA (I) treatment. The regions bordered by the red box in the insets in (F) roughly correspond to the imaged region. Note that differentiated petiole cells were imaged. Bars = 50 μm.
(J) A 0.89 μM BAP treatment induced WUS expression in Col-0 wild-type, clf-29, and ring1a ring1b seedlings. Error bars indicate the sd of three biological replicates, run in triplicate.
(K) The number of buds in isolated leaf axils of Col-0 or clf-29 mutants after a 2-week mock or BAP treatment. Error bars indicate the sd (n ≥ 10). *P < 0.05 and **P < 0.01 (Student’s t test).

