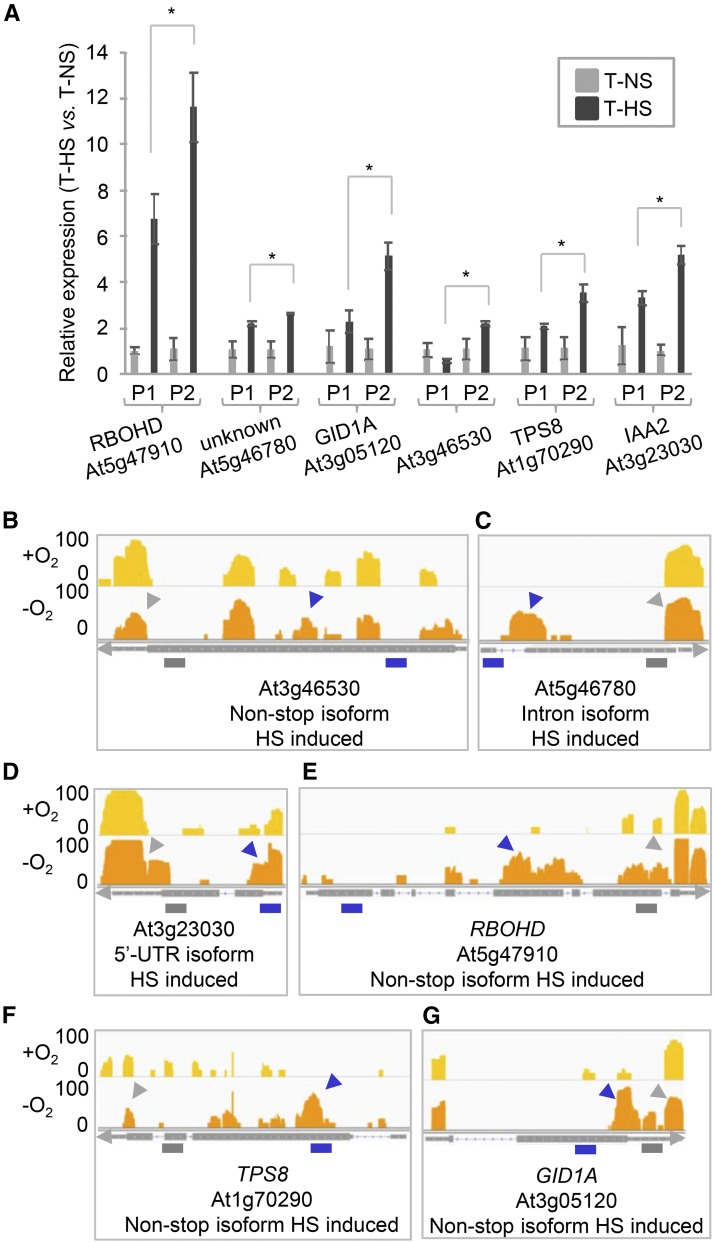
Figure 3.
Examples of Differential Poly(A) Site Choice in Hypoxic Plants.
(A) Quantitative RT-PCR analysis of poly(A) site abundance in 3′-UTR (P1) and noncanonical (P2) regions in plants grown in normoxic and hypoxic conditions. Error bars represent sd between three biological replicates (pool of ∼30 whole plants per condition), and asterisks are indicative of statistically significant differences using t test (P < 0.01, three biological replicates).
(B) and (E) to (G) PAT read coverage on selected genes. At3g46530, RBOHD (RESPIRATORY BURST OXIDASE HOMOLOG D; At5g47910), TPS8 (TREHALOSE-6-PHOSPHATASE SYNTHASE S8; At1g70290), and GID1A (GA INSENSITIVE DWARF1A; At3g05120) are examples of a non-stop isoforms induced under hypoxia condition (HS).
(C) At5g46780, an example of an intronic isoform induced under HS.
(D) At3g23030, an example of a 5′-UTR isoform induced under HS. The tracks for each gene in normoxic (+O2) and hypoxic (−O2) conditions are shown in the upper and lower panels, respectively. The purple arrow indicates the region of interest in each gene, and the gray arrow shows the 3′-UTR. The minimum and maximum read value of the scale used for each gene is indicated at the y axis (log2-transformed value). Purple bars represent primers that query the combined expression of canonical and noncanonical isoforms for a given gene (P2), while gray bars illustrate primers designed only for canonical isoforms (P1). T, total RNA; NS, normoxia; HS, hypoxia. Primers are listed in Supplemental Table 1.

