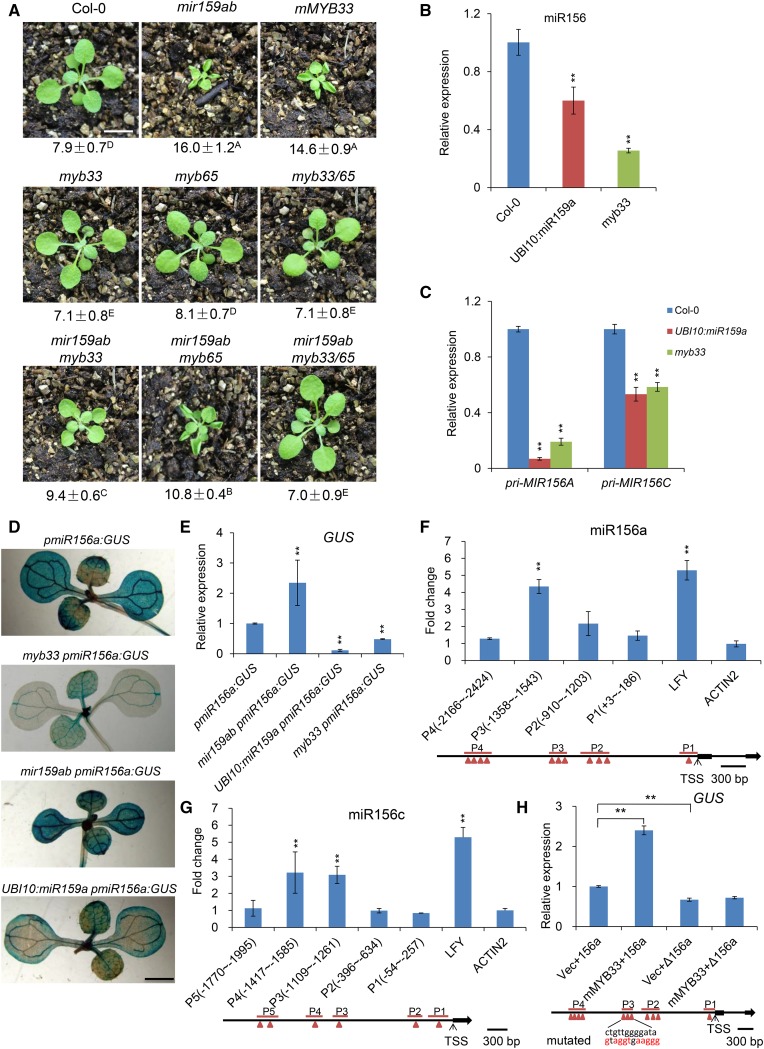
Figure 3.
MYB33 Is the Primary Gene Responsible for the Phenotype of mir159ab by Directly Binding to the Promoter of miR156a and miR156c to Regulate miR156 Transcription.
(A) Eighteen-day-old Col-0, mir159ab, mMYB33, myb33, myb65, myb33 myb65 (myb33/65), mir159ab myb33, mir159ab myb65, and mir159ab myb33 myb65 plants grown in short days. Numbers indicate the first leaf with abaxial trichomes. Different capital letters indicate significant difference between genotypes using one-way ANOVA at P < 0.01(n = 30 plants, ±sd; Supplemental File 1). Bar = 1 cm.
(B) The expression level of mature miR156 in Col-0, UBI10:miR159a, and myb33 plants in short days. Ten-day-old whole seedlings were sampled and analyzed. Asterisks indicate significant difference from Col-0 using Student’s t test (P < 0.01). All qRT-PCR data represent the mean of three biological replicates; values were normalized to the wild type (±sd).
(C) The expression level of Pri-MIR156A and Pri-MIR156C in Col-0, UBI10:miR159a, and myb33 plants in short days. Ten-day-old whole seedlings were sampled and analyzed. Asterisks indicate significant difference from Col-0 using Student’s t test (P < 0.01). All qRT-PCR data represent the mean of three biological replicates; values were normalized to the wild type (±sd).
(D) GUS staining analysis of 10-d-old pmiR156a:GUS, mir159ab pmiR156a:GUS, myb33 pmiR156a:GUS, and UBI10:miR159a pmiR156a:GUS plants in short days. Bar = 0.2 cm.
(E) Quantitative analysis of GUS expression in 10-d-old pmiR156a:GUS, mir159ab pmiR156a:GUS, myb33 pmiR156a:GUS, and UBI10:miR159a pmiR156a:GUS plants in short days using qRT-PCR method. All results were normalized to that of pmiR156a:GUS in the wild-type background. Asterisks indicate significant difference from pmiR156a:GUS using Student’s t test (P < 0.01). All qRT-PCR data represent the mean of three biological replicates ±sd.
(F) ChIP-qPCR analysis of MYB33 binding sites in the promoter region of miR156a. Chromatin from 10-d-old pMYB33:3×FLAG-mMYB33-3′UTR and pMYB33:HA-mMYB33-3′UTR seedlings grown in short days was immunoprecipitated with a polyclonal antibody to FLAG. Primers surrounding the putative MYB33 binding sites were designed upstream of the TSS of miR156a. The immunoprecipitated values were first normalized to the input values then divided by the pMYB33:HA-mMYB33-3′UTR to get a fold enrichment. The numbers represent the fold change relative to pMYB33:HA-mMYB33-3′UTR samples. Values are the mean of three biological replicates. P1 to P4 denote different PCR-amplified regions in the promoter region of miR156a. LFY was used as a positive control, whereas ACTIN2 was a negative control. Asterisks indicate significant difference from the value of ACTIN2 using Student’s t test (P < 0.01). Red triangles indicate the predicted MYB binding sites.
(G) ChIP-qPCR analysis of MYB33 binding sites in the promoter region of miR156c. Chromatin from 10-d-old pMYB33:3×FLAG-mMYB33-3′UTR and pMYB33:HA-mMYB33-3′UTR seedlings grown in short days was immunoprecipitated with a polyclonal antibody to FLAG. Primers surrounding the putative MYB33 binding sites in the miR156c promoter region were designed upstream of the TSS of miR156c. Values are the mean of three biological replicates. P1 to P5 denote different PCR-amplified regions in the promoter region of miR156c. LFY was used as a positive control, whereas ACTIN2 was a negative control. Asterisks indicate significant difference from the value of ACTIN2 using Student’s t test (P < 0.01). Red triangles indicate the predicted MYB binding sites.
(H) Activation of MIR156A transcription by direct binding of MYB33 to the cis-regulatory sequence in the promoter of MIR156A. GUS expression was quantitated using qRT-PCR in leaves of N. benthamiana infiltrated with Agrobacterium with different combinations of constructs. pmiR156a:GUS (156a), MIR156A transcriptional reporter construct; pΔmiR156a:GUS (Δ156a), MIR156A transcriptional reporter construct with a mutated cis-regulatory sequence to which MYB33 binds; UBI10:mMYB33, miR159-insensitive overexpression vector; pSY06, the control vector. Vec+156a (pSY06 + pmiR156a:GUS), mMYB33+156a (UBI10:mMYB33 + pmiR156a:GUS), Vec+Δ156a (pSY06 + pΔmiR156a:GUS), mMYB33+Δ156a (UBI10:mMYB33 + pΔmiR156a:GUS). Red letters indicate the mutated bases. Values were normalized to that of Vec+156a and are the mean of two biological replicates; asterisks indicate significant difference from Vec+156a using Student’s t test (P < 0.01).

