Figure 6.
At18 Complex Is Impaired in Docking or Sliding on DNA.
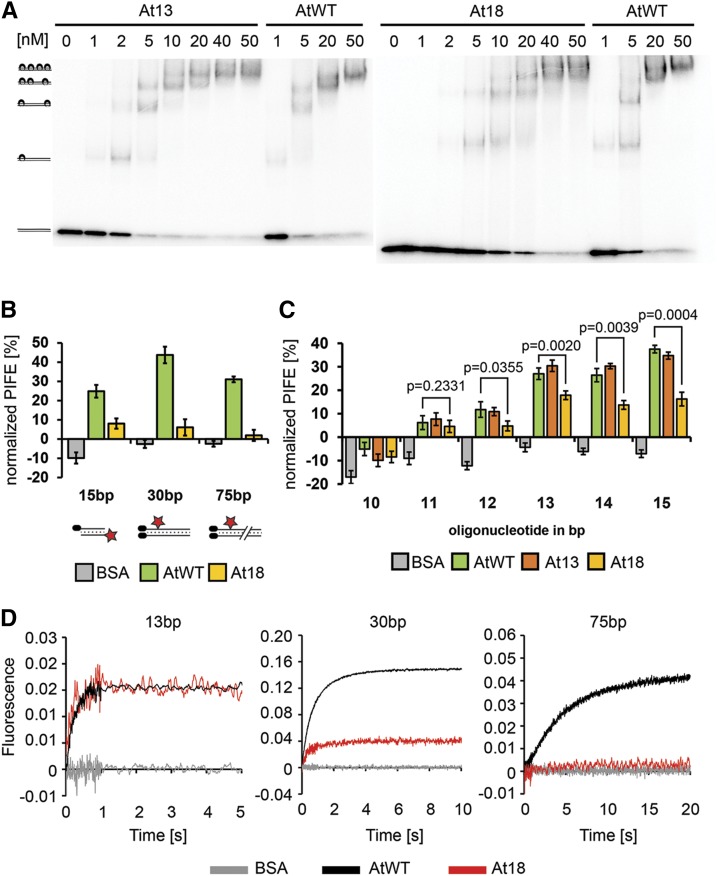
(A) EMSA of radioactively labeled 98-bp DNA probe (0.3 nM) with increasing concentrations of recombinant Ku complexes. Positions of Ku-DNA complexes with different stoichiometries are indicated on the left side of the gel.
(B) Steady state interaction of Ku at different positions along DNA determined by mwPIFE. PIFE was calculated as the relative difference in fluorescence upon protein binding. BSA was used as control. Standard deviations from three independent measurements are indicated. Cy3-labeled 15-bp, 30-bp, and 75-bp DNA probes used in the experiment are depicted below the chart.
(C) Analysis of Ku-DNA interaction by mwPIFE with 5′-end labeled DNA probes ranging from 10 to 15 bp. Standard deviations from three independent measurements are indicated. P values show significance of difference between wild-type and At18 complexes determined by two-tailed t test.
(D) Kinetic analysis of Ku-DNA binding by stop-flow using the 13-, 30-, and 75-bp DNA probes. Each trace represents the average of at least five individual measurements. Kinetic curves were scaled according to the data obtained with the 13-bp probe to normalize for the signal amplitude of the At18 variant.

