Table 1. Kinetic Model of Ku-DNA Association.
| Binding |
Docking/Sliding |
|||
|---|---|---|---|---|
| Ku_oligo | kon (nM−1 s−1) | koff (s−1) | Kd (nM) | kobs (s−1) |
| AtWT_13bp | 0.017 ± 0.010 | 2.2 ± 0.8 | 131 | Not observed |
| At18_13bp | 0.011 ± 0.006 | 1.6 ± 0.4 | 151 | Not observed |
| AtWT_30bp | 0.009 ± 0.002 | 1.1 ± 0.2 | 121 | 0.63 ± 0.26 |
| At18_30bp | 0.009 ± 0.006 | 1.3 ± 0.2 | 143 | Not observed |
| AtWT_75bp | – | – | – | 0.28 ± 0.04 |
| At18_75bp | – | – | – | Not observed |
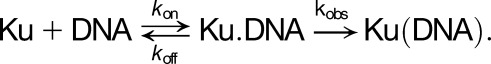
Kinetics measurements with three different DNA substrates identified the occurrence of at least two kinetic phases during Ku-DNA association: a fast initial binding followed by a docking/sliding phase. Individual values of the rate of Ku-DNA association (k1) and dissociation (k-1) and equilibrium dissociation constant (Kd
= k-1/k1) evaluated from the concentration dependence of the observed rate of the initial binding phase are shown. The rate of docking/sliding phase represents the value of the second exponential phase observed in the kinetic data (kobs, the combination of individual rate constants of unknown mechanism of sliding). The docking/sliding phase observed with the 30-bp probe may represent different processes than the sliding phase detected with the 75-bp probe. The kinetic model of Ku binding to DNA is represented by the following equation: