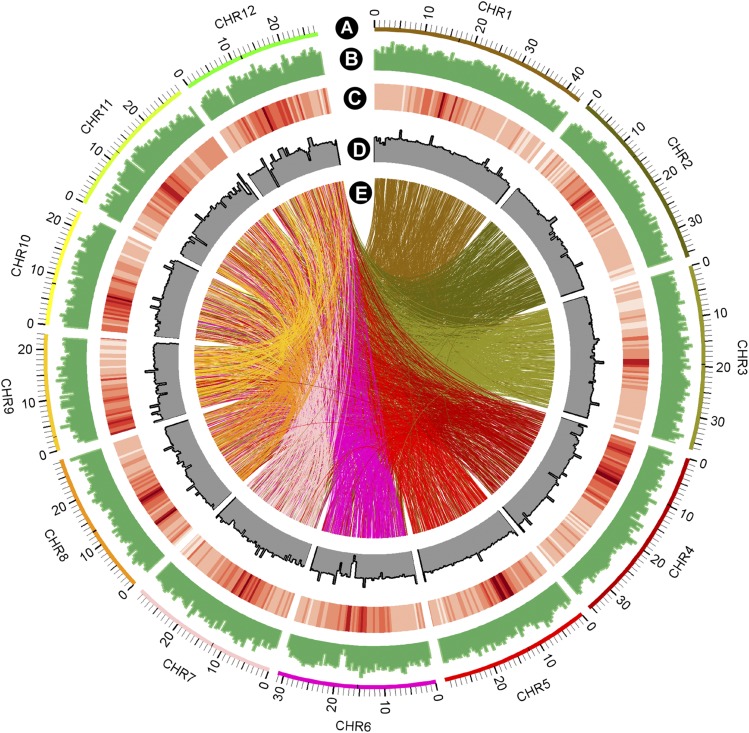
Figure 2.
Genome-Wide Distribution of FN-Induced Mutations in the Kitaake Rice Mutant Population.
(A) The 12 rice chromosomes represented on a megabase scale.
(B) Genome-wide distribution of FN-induced mutations in nonoverlapping 500-kb windows. The highest column equates to 242 mutations/500 kb.
(C) Repetitive sequences in the reference genome in nonoverlapping 500-kb windows. The darker the color, the higher the percentage content of repetitive sequences.
(D) The sequencing depth of the parental line X.Kitaake. The highest column indicates 300-fold.
(E) Translocations are represented with connecting lines in the color of the smaller-numbered chromosome involved in the translocation.

