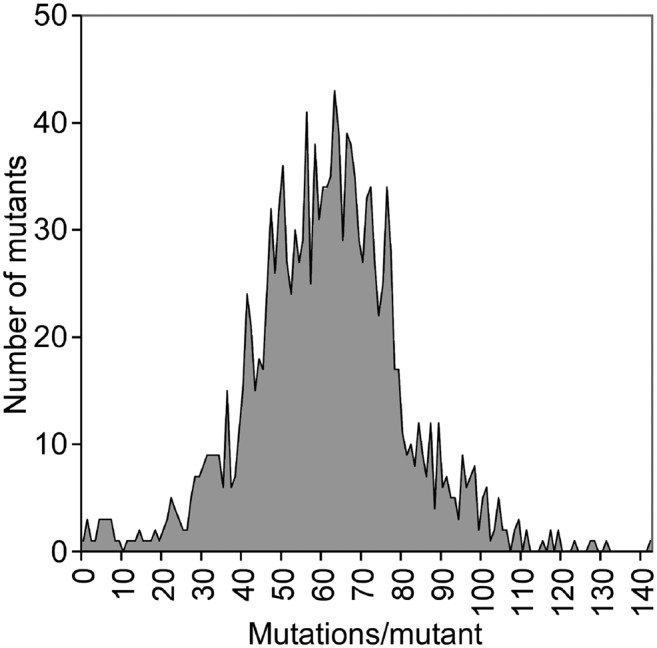
Figure 3.

Distribution of the Number of Mutations per Line in the Kitaake Rice Mutant Population.
The x axis represents the number of mutations per line. The y axis indicates the number of mutants containing the indicated number of mutations.

Distribution of the Number of Mutations per Line in the Kitaake Rice Mutant Population.
The x axis represents the number of mutations per line. The y axis indicates the number of mutants containing the indicated number of mutations.