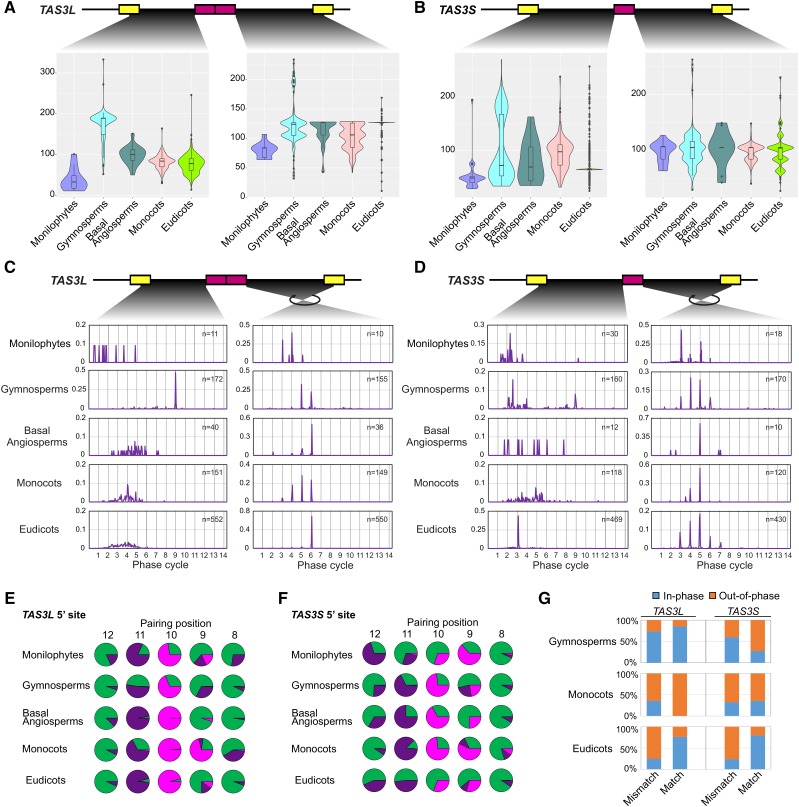
Figure 6.
The Distances between the Two Target Sites of miR390 and the Central tasiARF Are under Strong Selection.
(A) and (B) Variation of the distances between two miR390 target sites and tasiARF of TAS3L (A) or TAS3S (B) genes in different lineages of vascular plants. In both panels, the lower graphs contain violin plots for each lineage representing the distribution of these distances; internal boxes represent the median as a heavy line surrounded by a box defining the upper and lower quartiles.
(C) and (D) Distribution of the distances between two miR390 target sites and tasiARF of TAS3L (C) or TAS3S (D) genes in different lineages of vascular plants. The y axis is the percentage of TAS3 genes with distances occurring within a given position (the x axis). The 21-nucleotide phased positions (phase “cycles”) are marked as gray gridlines.
(E) and (F) Variation in pairing of the 8th to 12th nucleotide positions (relative to the 5′ end of miR390) of the 5′ target site of TAS3L (E) and TAS3S (F). The type of miR390-TAS3 pairing observed at different nucleotide positions, relative to the 5′ end of miR390, are shown with A:U/C:G matches denoted in green, G:U matches in purple, and all mismatches in pink.
(G) Ratio of the 5′ miR390 target sites in phase or out of phase to the tasiARF in terms of different nucleotide pairing at the 10th position (match, U; mismatches, A, C, and G as the 10th nucleotide of miR390 is “A”).

