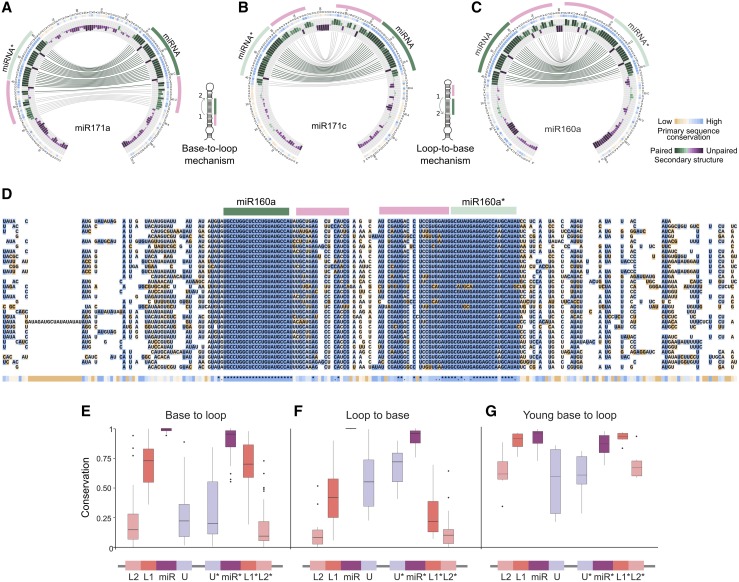
Figure 3.
Conservation and Divergence of Precursors Processed in Different Directions.
(A) to (C) Circos representation of miR171a (A), miR171c (B), and miR160a (C). miR171a is processed from the base, while miR171c and miR160a are processed from the loop. Note the different position of the additional conserved regions (pink line) in the precursors according their processing direction. The insets show schemes of precursors processed in base-to-loop or a loop-to-base direction.
(D) Alignment of miR171c precursors from A. lyrata (top), M. domestica, M. truncatula, S. lycopersicum, B. rapa FPsc, E. grandis, C. grandiflora, P. persica, C. sinensis, L. usitatissimum, C. clementina, G. max, V. vinifera, R. communis, S. purpurea, B. stricta, C. sativus, A. coerulea, M. guttatus, M. esculenta, E. salsugineum, C. papaya, A. thaliana, C. rubella, T. cacao, P. trichocarpa, P. vulgaris, G. raimondii, F. vesca, and S. tuberosum (bottom).
(E) and (F) Box plot showing the conservation of different precursor regions using phastCons for precursors processed in base-to-loop (E) or loop-to-base (F) direction.
(G) Analysis using young MIRNAs processed in base-to-loop direction. The band inside the box represents the median, the bottom and top of the box are the first (Q1) and third (Q3) quartiles, dots are outliers, upper whisker denotes min (max(x), Q3 + 1.5 * (Q3 − Q1)), and lower whisker denotes max(min(x), Q1 − 1.5 * (Q3 − Q1)).

