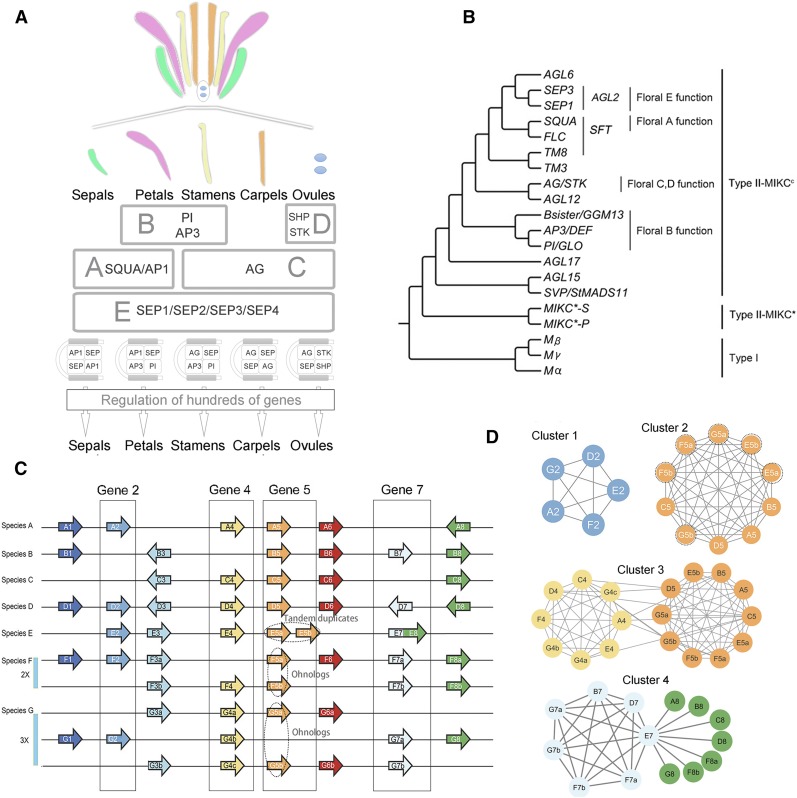
Figure 1.
Summary of the MADS-Box Genes and Principles of Phylogenomic Synteny Network Analysis.
(A) Diagram illustrating the ABCDE floral development model. The A- and E-function genes are essential for sepal identity; the A-, B-, and E-function genes for petal identity; the B-, C-, and E-function genes for stamen identity; the C- and E-function genes for carpel identity; and the D-, C-, and E-function genes for ovule identity.
(B) The consensus phylogenetic tree showing the relationships for the different functional gene clades of the MADS-box gene family. The combined clade containing the SQUA-, FLC-, and TM8-like genes is referred to as SFT in this study.
(C) Hypothetical example of a parallel coordinate plot for synteny comparisons across seven species (A–G) for which species F has undergone a whole-genome duplication (WGD = 2x) and species G a whole-genome triplication (WGT = 3x). Examples of tandem duplicates and ohnologs/syntelogs of Gene 5 are indicated by the dotted ovals. Genes 2, 4, 5, and 7 are each boxed as examples of network view of synteny relationships.
(D) Synteny network of Gene 2 (Cluster 1, less conserved), Gene 5 (Cluster 2, highly conserved and includes tandem duplicates and ohnologs), Gene 4 and Gene 5 [Cluster 3, where genes are members of larger gene family and thus are interconnected; in this case, we suppose Gene 4 and Gene 5 belong to a same gene family, which share similar domain(s), and synteny is checked for this whole gene family], and Gene 7 (Cluster 4, where gene E7 represents an actual gene fusion of protein domain from a neighboring gene or is an artifact due to gene misannotation, only synteny of Gene 7 homologs is being checked synteny). Nodes represent syntenic genes, and edges (lines) represent a syntenic connection between two nodes. Edge length in this example is noninformative.

