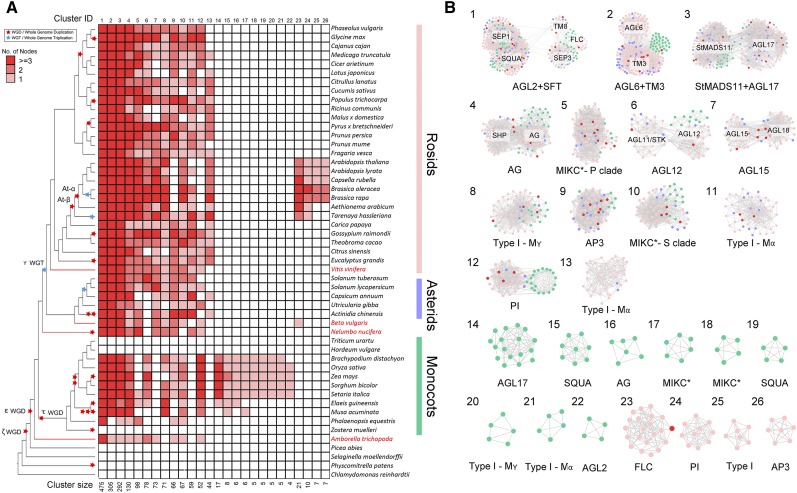
Figure 3.
Phylogenetic Profiling and Detailed Network Representations for a Set of Selected Important MADS-Box Synteny Network Clusters.
(A) Phylogenetic profiling of 26 example clusters from all the 95 clusters at k = 3 (Supplemental Figure 3). Red-colored cells depict the presence of at least one syntelog in the different species. The phylogenetic profiling approach identified large clusters containing genes from various subfamilies, such as “AGL2+SQUA” (Cluster 1) and “AGL6+TM3” (Cluster 2), or lineage-specific clusters, such as of PI (Cluster 24) and AP3 (Cluster 26) in the Brassicaceae, and “AGL17” (Cluster 14) and “SQUA” (Cluster 15) in monocots. Species names are shown on the right side. The basal rosid V. vinifera, the basal eudicots B. vulgaris and N. nucifera, and the basal angiosperm A. trichopoda are highlighted in red. Red and blue stars on the tree indicate known WGD and whole-genome triplication (WGT) events, respectively, on the phylogenetic tree on the left side. The cluster ID and size are indicated at the top and bottom, respectively. The red color scale of the cell indicates the number of nodes (genes grouping in that cluster) found in a single species.
(B) Clusters from (A), which can be divided into large-conserved clusters (Clusters 1–13) and lineage-specific clusters (monocots [Cluster 14–22] and Brassicales [Cluster 23–26]). The node colors represent rosids (light pink), asterids (blue), and monocots (green); the nodes belonging to A. trichopoda, V. vinifera, B. vulgaris, and N. nucifera are shown in red.

