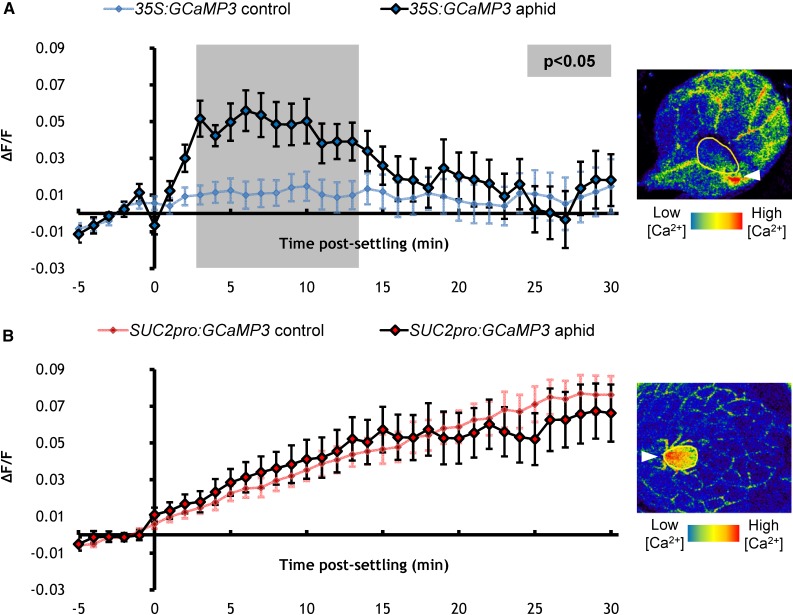
Figure 4.
[Ca2+]cyt Elevations Are Not Detected in the Phloem around Aphid-Feeding Sites.
(A) Left: Normalized fluorescence (∆F/F) around aphid-feeding sites of 35S:GCaMP3 aphid-exposed leaves and no-aphid controls. Error bars represent se of the mean (n = 31). Gray shading indicates significant difference between treatments (Student’s t test within GLM at P < 0.05). Right: Representative stereomicroscope image of a [Ca2+]cyt elevation seen around an aphid-feeding site on a 35S:GCaMP3 leaf. GFP fluorescence is color-coded according to the inset scale. Aphid outlined in yellow and feeding site indicated with an arrowhead. Image taken at 3 min after settling.
(B) Left: ∆F/F around the aphid-feeding sites of SUC2pro:GCaMP3 aphid-exposed leaves and no-aphid controls. Error bars represent se of the mean (n = 34). Right: Representative stereomicroscope image of the absence of [Ca2+]cyt elevation around an aphid-feeding site on a SUC2pro:GCaMP3 leaf. GFP fluorescence is color-coded according to the inset scale. Aphid outlined in yellow and feeding site indicated with an arrowhead. Image taken at 3 min after settling.

