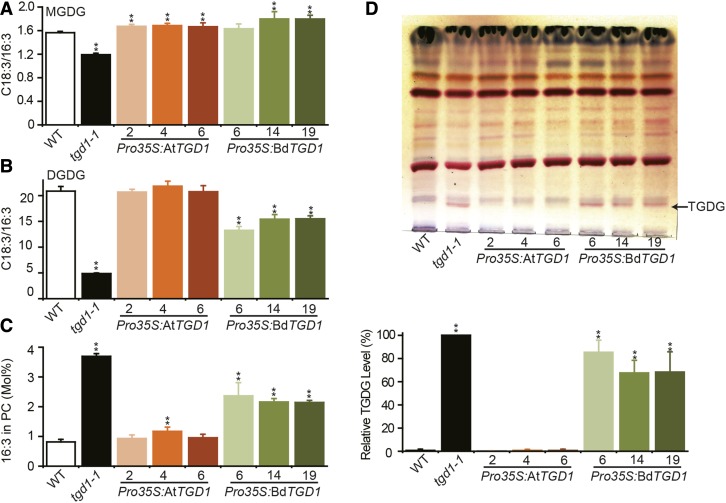
Figure 4.
Expression of Pro35S:BdTGD1 in the Arabidopsis tgd1-1 Mutant Only Partially Restored Leaf Lipid Phenotypes.
(A) to (C) Ratios of C18:3/16:3 in MGDG (A) and DGDG (B) and molar fraction of 16:3 in PC (C). The wild type and three independent Pro35S:AtTGD1- or Pro35S:BdTGD1-expressing lines each (designated by numbers) in the Arabidopsis tgd1-1 mutant background and the tgd1-1 mutant were compared. Total lipids were extracted from 4-week-old Arabidopsis leaves. The molar percentages of individual FAs relative to total FAs in each lipid species were quantified by GC-FID of FAMEs. The error bars represent sd from three independent plants. Significant differences compared with the wild type are indicated (Student’s t test): *P < 0.05 and **P ≤ 0.01.
(D) Expression of Pro35S:BdTGD1 did not rescue TGDG accumulation in the Arabidopsis tgd1-1 mutant. The upper panel shows thin-layer chromatography of polar lipids. The wild type and three independent Pro35S:AtTGD1- or Pro35S:BdTGD1-expressing lines each (designated by numbers) in the Arabidopsis tgd1-1 mutant background and the tgd1-1 mutant were compared. Glycolipids were visualized by α-naphthol staining. The arrow indicates the diagnostic TGDG (pink band). The lower panel shows the relative quantification of TGDG in both Pro35S:BdTGD1 and Pro35S:AtTGD1 lines based on the TLC results in Figure 4D and Supplemental Figures 8D and 8E. The TGDG content in tgd1-1 was treated as 100%. The relative amount of TGDG in individual transgenic lines was compared with that in tgd1-1 using ImageJ. The error bars represent sd from three independent plants. Significant difference compared with the wild type is indicated (**P ≤ 0.01, Student’s t test).

