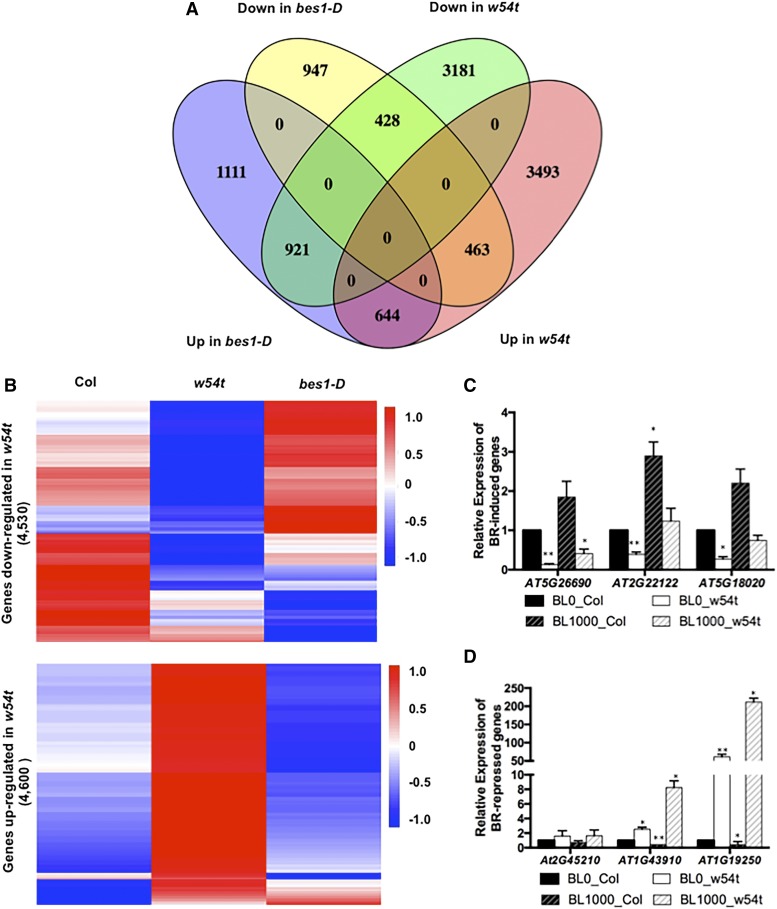
Figure 2.
WRKY46, WRKY54, and WRKY70 Regulate the Expression of BR Target Genes.
(A) Venn diagram showing overlaps among genes up- or downregulated in w54t with those differentially expressed in bes1-D.
(B) Clustering analysis of genes differentially expressed in w54t under control conditions within the wild type, w54t, and bes1-D. Values indicate normalized expression levels.
(C) The expression of genes downregulated in w54t was examined using 4-week-old plants treated with or without 1 μM BL. The averages and sd are derived from three biological replicates.
(D) The expression of genes upregulated in w54t was examined as described in (C).

