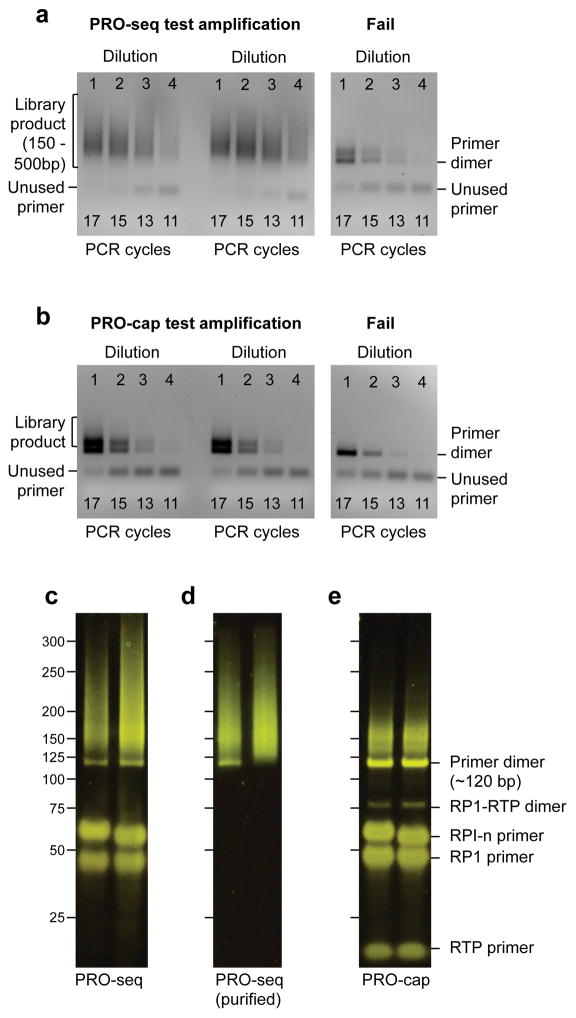
Figure A.2. Gel images of library products.
(A) PRO-seq libraries at the test amplification stage (step 101). 3 different samples are loaded on the agarose gel, each at 4 dilutions. From the left of each series, the 4 dilutions are equivalent to 17, 15, 13, and 11 cycles of full amplification. The gel image in left panel shows two successful PRO-seq libraries. Optimal amplification cycles are determined by comparing both the intensities of library products and the unused primers. Optimal amplification cycles are when 50–75% of the primers remain unused (13 cycles for this example). Gel image of a failed library preparation is shown on the right panel; only primer dimers are detected.
(B) PRO-cap libraries at the test amplification stage (step 101). Library products are smaller in size and amount, because most PRO-cap RNA molecules are from paused RNA polymerase. 15 cycles were optimal for these samples.
(C) Two PRO-seq libraries after full amplification analyzed by 8% PAGE (step 118). Labels on the left indicate DNA sizes. Note the presence of unused primers around 50 bp and primer dimer bands ~120 bp. The library product is the smear above the primer dimer band.
(D) Two PRO-seq libraries after the size selection analyzed by 8% PAGE (step 119). PRO-seq library on the left still has some residual primer dimer.
(E) Two PRO-cap libraries after the full amplification analyzed by 8% PAGE (step 118). Note that there are additional primer and primer dimer bands compared to PRO-seq.

