
Figure 1. Cardiac mitochondrial phospholipid acyl chains are remodeled in response to a high fat diet.
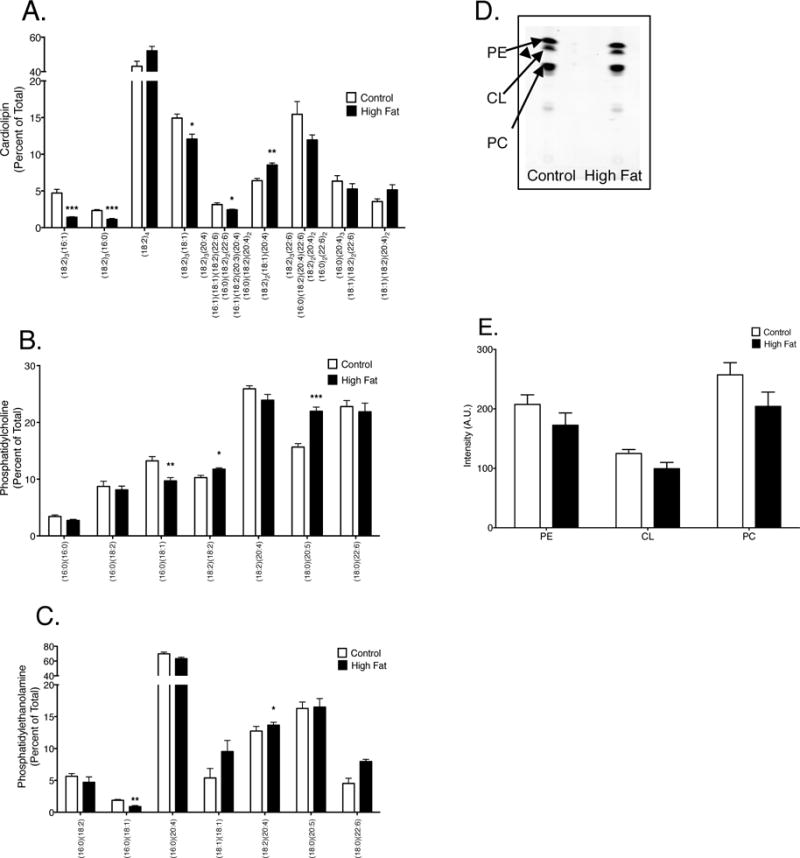
Acyl chain composition of (A) CL, (B) PC, and (B) PE in cardiac mitochondria. (D) Representative TLC plate of phospholipids assayed from cardiac mitochondria of lean and obese mice. (E) Quantification of total CL, PC, and PE in lean controls versus obese animals. Data are the average ± S.E.M. from 4 independent experiments. The asterisks indicate significance from control (*p < 0.05, ** p < 0.01, ***p < 0.001).