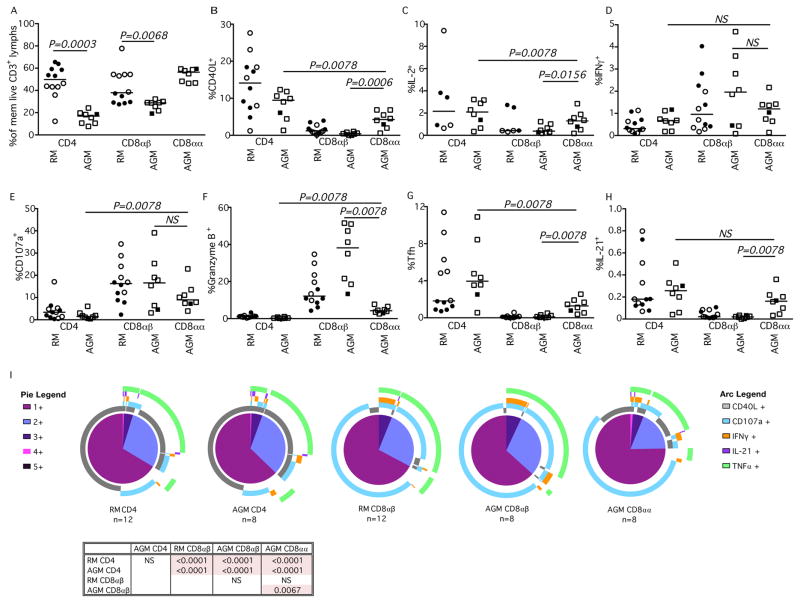
Fig. 4. Functionality of LN-resident T cell subsets in RMs and AGMs.
Characterization of (A) memory T cell CD4+, CD8αβ, and CD8αα subsets and their expression of (B) CD40L, (C) IL-2, (D) IFNγ, E) CD107a, (F) Granzyme B, (G) Tfh markers CXCR5 and PD-1, (H) IL-21, and TNFα (graphical data not shown) after SEB stimulation in RM (circles) and AGM (squares). Closed symbols represent SIV-uninfected animals, while open symbols represent SIV-infected animals. (I) SPICE analysis illustrating number of functions in corresponding colored pie sections (legend on the left) and specific functionality as illustrated by the colored arcs (legend on the right). Multifunctional profile differences between cellular subsets (P-values) were assessed by the SPICE software permutation test. All horizontal bars in A–H reflect the median of that T cell subset. All P-values greater than 0.05 are represented as NS (not significant).

